

The single most effective approach to loan scenario analysis is to build a documented, assumption-transparent model that maps quantified shocks directly to borrower-level risk metrics, then ties every output to a pre-defined credit action. Credit committees and examiners expect an auditable record, not a back-of-envelope estimate.
Apply these six steps before any scenario work reaches a committee:
- Define your scenario set. Run at minimum a base case, a downside, and a stress case. Three to five scenarios calibrated to the specific exposure is the practitioner standard.
- Lock your data sources. Anchor the base case to audited or reviewed financials; document every external data source (rate curves, vacancy benchmarks, sector indices) with a date stamp.
- Build model controls. Separate inputs, calculations, and outputs. Add assertion rows that flag broken logic before a reviewer sees the file.
- Document assumptions in plain language. Each shock needs a one-sentence narrative explaining what it represents and why the magnitude is appropriate.
- Set escalation triggers. Pre-define the debt service coverage ratio (DSCR) floor, loan-to-value (LTV) ceiling, and liquidity runway threshold that require committee escalation or a mitigant.
- Save a complete credit file package. Input snapshots, model versions, sensitivity matrices, and the committee slide deck all belong in the file.
Regulators and credit committees expect scenario work to be proportionate, independently reviewable, and integrated with allowance for credit losses (ACL) or allowance for loan and lease losses (ALLL) provisioning decisions.
Key Takeaways
Effective loan scenario analysis best practices require a documented, assumption-transparent model that maps quantified shocks to risk metrics and ties every output to a pre-defined credit action.
| Point | Details |
|---|---|
| Anchor the base case first | Build on audited or reviewed financials before defining any downside or stress scenario. |
| Separate inputs, calculations, outputs | A structured workbook with assertion rows and a scenario toggle is the minimum standard for audit-readiness. |
| Pre-define decision thresholds | Set DSCR floors, LTV ceilings, and liquidity triggers before running the model to prevent confirmation bias. |
| Document every assumption in plain language | Each shock needs a one-sentence narrative tied to a verifiable historical or forward-looking benchmark. |
| Refresh models on a defined schedule | Update driver calibrations at least annually and whenever the borrower delivers new financial statements. |
Table of Contents
- What loan scenario analysis is, and when you should run it
- Core components every loan scenario model must include
- Step-by-step process for running loan scenario analysis
- Model and Excel best practices that make scenario work defensible
- U.S. regulatory and audit expectations for scenario analysis
- Common modeling mistakes and the validation checks that catch them
- A worked example structure and template outline
- How to present scenario results to a credit committee
- Macroeconomic data sources and portfolio diversification in scenario design
- What most analysts get wrong about scenario analysis
- Ready to apply scenario analysis to a live deal?
- Sources
- FAQ
What loan scenario analysis is, and when you should run it
Loan scenario analysis is the structured process of translating a set of defined economic or borrower-specific shocks into quantified changes in credit risk metrics. The core logic links driver assumptions (revenue, rates, occupancy, costs) through a borrower’s financial mechanics to risk outcomes: DSCR, LTV, covenant compliance, and liquidity runway.
DSCR (debt service coverage ratio) measures net operating income divided by total debt service. LTV (loan-to-value) measures outstanding loan balance against collateral value. ACL/ALLL refers to the reserve a lender holds against expected credit losses on its portfolio.
Loan-level scenarios are appropriate when:
- Originating a larger commercial credit where a single borrower’s performance materially affects the institution’s risk profile.
- Testing covenant compliance during annual review or when a borrower reports a material financial change.
- Underwriting a new credit in a sector with elevated volatility (hospitality, retail, construction).
- Evaluating a workout or restructuring proposal.
Portfolio-level scenarios are appropriate when:
- Assessing concentration risk in a sector, geography, or product type.
- Supporting capital planning and ACL/ALLL provisioning estimates.
- Responding to a supervisory request for stress testing across a loan category.
- Monitoring aggregate exposure to a shared macro driver (e.g., rising benchmark rates).
Time horizons follow the decision purpose. Monthly cash-flow projections serve liquidity and draw-schedule analysis. A 12–36-month horizon covers covenant testing and capital planning. Construction loans often require scenario runs tied to milestone draws rather than calendar periods. Shorten the horizon when the credit is in or near distress; lengthen it when the purpose is strategic capital adequacy planning.
Core components every loan scenario model must include
A scenario model that omits a material driver produces misleading outputs. The following components belong in every loan-level model, regardless of product type.
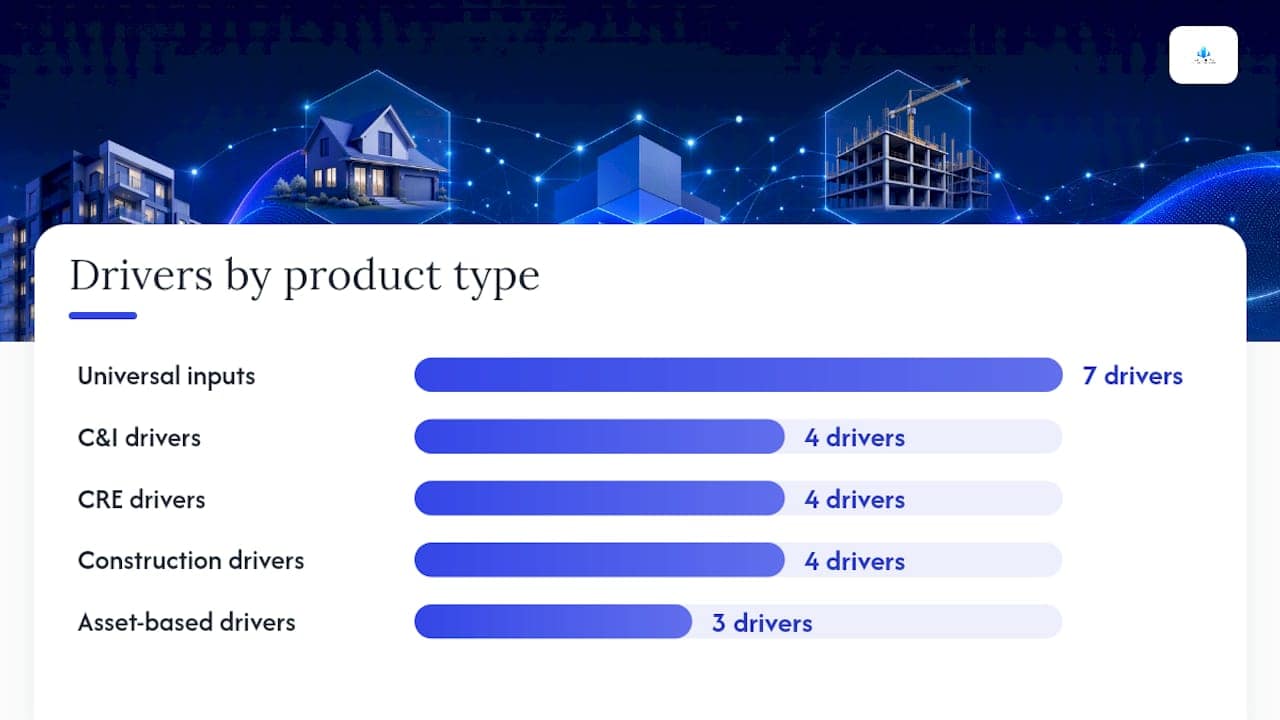
Universal inputs:
- Baseline income statement and balance sheet, anchored to the most recent audited or reviewed financials.
- Debt schedule: outstanding balance, amortization, maturity, rate type (fixed vs. floating), and any PIK or deferred interest features.
- Collateral valuation: current appraised value, cap rate or comparable sales basis, and the depreciation or vacancy assumption used.
- Covenant mechanics: exact financial covenant definitions as written in the loan documents, not approximations.
- Working capital cycle and seasonal cash patterns.
- Capital expenditure schedule, particularly for construction and value-add credits.
- Liquidity runway: cash on hand, available credit facilities, and projected burn rate under each scenario.
Driver selection by product type:
- Commercial and industrial (C&I): revenue growth, EBITDA margin, working capital turns, and benchmark rate sensitivity on floating-rate debt.
- Commercial real estate (CRE): occupancy rate, effective rent, cap rate, and operating expense ratio.
- Construction: draw timing, cost overrun percentage, absorption pace, and exit cap rate or sale price.
- Asset-based lending: eligible receivables concentration, advance rate, and collateral liquidation value under stress.
Keep models parsimonious. Include a driver only when it is material to the credit outcome and when you have a defensible basis for calibrating it. A model with 30 uncertain inputs is harder to defend than one with eight well-sourced ones.
Pro Tip: Link each narrative scenario to a specific historical or forward-looking benchmark. A “severe downside” for a multifamily credit might reference the peak vacancy observed in that submarket during 2008–2010. Calibrating to named historical extremes gives examiners and committee members a verifiable reference point rather than an arbitrary percentage.
Step-by-step process for running loan scenario analysis
The workflow below applies to loan-level analysis. Portfolio-level work follows the same logic but aggregates borrower outputs into concentration and provisioning summaries. Commercial loan underwriting typically sequences document collection, financial spreading, and credit analysis before scenario work begins, so scenario analysis is the analytical layer that sits on top of a completed spread.
- Scope the analysis. Define the purpose (origination, annual review, stress test), the time horizon, and the scenario count. Larger credits and concentrated sectors warrant borrower-specific stress tests; high-volume retail books are better served by cohort overlays.
- Build and validate the base case. Anchor to audited or reviewed financials. Normalize for non-recurring items. Confirm the model ties to source documents before running any scenarios. Per the NCUA Examiner’s Guide, a complete credit approval document must include historical financials, debt service analysis, and documented assumptions so approvers can make an informed decision independently.
- Define scenario narratives. Write a one-sentence description for each scenario: what event or condition it represents, the time frame, and the primary drivers affected. Base, downside, and stress are the minimum set. An optimistic case is useful when pricing risk or evaluating prepayment assumptions.
- Calibrate inputs. Translate each narrative into numeric driver assumptions. Use both sensitivity analysis (isolate one driver) and multi-factor scenarios (combine shocks) — sensitivity analysis finds marginal impacts; multi-factor scenarios reveal interactions and timing risks.
- Run the model and calculate risk metrics. Outputs for each scenario must include DSCR, LTV, covenant headroom, liquidity runway, and expected loss mapping. Record the output for every scenario in a summary matrix.
- Run sensitivity testing. Vary the two or three most material drivers by ±10–20% around each scenario’s central assumption. This identifies the model’s most sensitive levers and tests whether the scenario boundaries are appropriate.
- Apply the decision framework. Map outputs to pre-defined credit actions using the Shock → Transmission → Decision structure: define shocks, link them to borrower mechanics, and pre-set decision actions tied to quantitative thresholds such as repricing, covenant tightening, or reserve requirements.
- Document and package the credit file. Save input snapshots, the model file with version notation, the sensitivity matrix, the scenario narrative document, and the committee presentation. Every deliverable should be named and dated.
Decision gates:
- DSCR falls below the covenant floor in the base case: require mitigants before approval.
- DSCR breaches the covenant floor only in the stress case: document the finding and set a monitoring trigger.
- LTV exceeds the policy ceiling in the downside case: escalate to credit committee with a collateral recovery analysis.
- Liquidity runway falls below 90 days in the base case: decline or restructure.
Model and Excel best practices that make scenario work defensible
Model structure is not an aesthetic preference. A poorly organized workbook produces errors that survive committee review and fail examiner scrutiny. The lender-ready model standard requires separated inputs, calculations, and outputs, plus integrated financial statements, a debt schedule, covenant checks, and a scenario selector.
Workbook architecture:
- Inputs sheet: all external data, borrower financials, and rate assumptions in one place. No hardcoded numbers anywhere else in the workbook.
- Assumptions sheet: scenario definitions, driver calibrations, and the narrative for each scenario. This sheet is what an examiner reads first.
- Calculation sheets: income statement, balance sheet, cash flow, debt schedule, and covenant mechanics. No inputs here; only formulas referencing the inputs and assumptions sheets.
- Outputs sheet: summary metrics for each scenario in a single matrix. Pivot-ready for committee decks.
- Reconciliation checks: balance-sheet tie, cash-sweep logic verification, and covenant formula match to loan documents.
Version control and scenario toggles:
- Name every saved version with a date, analyst initials, and a brief change note (e.g.,
CRE_ScenarioModel_2026-03-14_JR_RevOccAdj.xlsx). - Use a scenario selector cell (a dropdown or numbered toggle) that switches all scenario-dependent cells simultaneously. Never maintain parallel copies of the same model with manual overrides.
- Log every material change in a version tab: date, analyst, what changed, and why.
Excel hygiene:
- Add assertion rows that flag when a balance sheet does not tie, when DSCR falls outside a plausible range, or when a formula references a hardcoded number outside the inputs sheet.
- Avoid circular references. If a model requires iteration (e.g., a revolver that depends on ending cash), document the iteration logic explicitly.
- Format outputs for direct paste into committee slides: consistent decimal places, labeled rows, and scenario columns clearly named.
When scenario complexity exceeds what a single Excel workbook can manage reliably, lending analytics platforms offer governed, auditable environments with role-based approvals and automated version logging. The governance implication is significant: a platform with built-in controls reduces the risk of undocumented manual overrides that examiners flag. AI-assisted underwriting tools are increasingly used to automate data capture and spreading, freeing analysts to focus on scenario calibration and interpretation rather than data entry.
Pro Tip: Save a frozen input snapshot (a values-only paste of the inputs sheet) alongside the live model in the credit file. If the model is later updated, the snapshot preserves the exact assumptions that supported the original credit decision. This is the single most useful audit-trail practice and takes under two minutes to execute.
U.S. regulatory and audit expectations for scenario analysis
Examiners from the OCC, FDIC, and Federal Reserve do not evaluate scenario analysis in isolation. They assess it as part of a broader credit risk management framework. The OCC’s Comptroller’s Handbook states that sound risk management across a loan’s life cycle requires internal controls, timely and accurate reporting, and risk assessments proportionate to the institution’s size and complexity.
Interagency guidance on credit risk review systems requires institutions to maintain an independent, ongoing credit risk review function that identifies loans with actual or potential credit weaknesses and supports ACL/ALLL estimation and reporting. Independence means the reviewer did not originate the credit and has no production incentive tied to the outcome.
The FDIC Examination Policies Manual specifies that effective loan review systems must validate risk ratings, identify portfolio trends, and provide management and boards with comparative trend reporting to support provisioning and corrective action decisions.
Audit checklist for scenario analysis:
- Model validation: has an independent party reviewed the model logic, formula integrity, and output reasonableness?
- Data lineage: can every input be traced to a source document with a date?
- Scope documentation: is the scenario set appropriate for the credit’s size, complexity, and product type?
- Review frequency: are scenarios refreshed at origination, annual review, and upon material adverse change?
- ACL/ALLL linkage: do scenario outputs feed directly into the provisioning methodology with documented mapping?
- Board and committee reporting: are scenario results summarized in a format that supports governance-level decisions?
Reporting template elements:
- One-sentence scenario narrative per case.
- Topline metrics table: DSCR, LTV, covenant headroom, and liquidity runway for each scenario.
- Sensitivity matrix showing the impact of the two most material drivers.
- Recommended credit action with the quantitative trigger that supports it.
- Analyst attestation and reviewer sign-off with dates.
The FDIC’s Loan Analysis School training program reinforces that assumptions must be documented in plain language and that scenario counts should be calibrated to the exposure, with borrower-specific tests for larger credits and cohort overlays for high-volume books.
Common modeling mistakes and the validation checks that catch them
Most scenario analysis failures trace to a small set of recurring errors. Identifying them before committee submission is faster and less costly than defending a flawed model to an examiner.
Top recurring mistakes:
- Over-reliance on historical averages. Using a three-year average revenue growth rate as the base case when the most recent year shows a material decline understates current risk. The base case should reflect the most current, defensible view of performance.
- Ignoring covenant breach timing. A model may show that DSCR recovers by year three, but if it breaches the covenant floor in month eight, the lender has a default event regardless of the long-run trajectory. Model covenant compliance at each measurement date, not just at year-end.
- Double-counting risk. Applying a revenue shock and simultaneously increasing the discount rate on collateral without documenting the relationship between them can overstate stress severity in ways that are hard to defend.
- Inadequate sensitivity ranges. Testing a ±5% revenue variance when the sector has historically experienced ±25% swings produces a sensitivity matrix that provides no useful information.
- Mismatched covenant definitions. Using an approximation of the covenant formula rather than the exact language from the loan documents produces outputs that cannot be compared to the actual trigger.
Red flags that require deeper review or model rework:
- DSCR drops more than 0.30x between the base and downside cases without a clear driver explanation.
- LTV jumps above 80% in the downside case for a credit originally underwritten at 65% LTV.
- Liquidity runway falls below 60 days in the base case.
- Covenant headroom is less than 10% of the covenant threshold in the base case.
- The model shows no scenario where the borrower breaches a covenant, regardless of shock severity.
Validation checklist (run before committee submission):
- Balance sheet ties to zero across all scenarios.
- Cash sweep logic matches the loan agreement’s waterfall provisions.
- Covenant formulas match the loan document definitions verbatim.
- All inputs reference the inputs sheet; no hardcoded numbers in calculation sheets.
- Scenario selector correctly switches all scenario-dependent cells.
- Output metrics are consistent with the narrative descriptions in the assumptions sheet.
Back-testing is underused. After a real adverse event, compare the scenario that most closely matched the outcome to the actual results. Recalibrate shock magnitudes where the model was materially off. This practice builds institutional knowledge and produces more defensible calibrations for future credits.
A worked example structure and template outline
The following structure applies to a standard commercial real estate or C&I credit. It is a template skeleton, not a full numeric model. Adapt driver selections and output metrics to the specific product type.
Credit file folder structure:
01_Source_Documents— borrower financials, rent rolls, appraisals, loan documents.02_Spreading— normalized financial spreads with source document references.03_Scenario_Model— the live workbook with version log tab.04_Input_Snapshots— values-only frozen copies of the inputs sheet for each model version.05_Outputs— scenario summary matrix, sensitivity matrix, and committee slide deck.06_Assumptions_Narrative— plain-language description of each scenario and driver calibration.
Worked example narrative (CRE income-producing property):
A stress-testing framework anchored to audited financials defines three cases. The base case holds occupancy at the current 92% and applies a modest rent growth assumption consistent with submarket data. The downside case reduces occupancy to 80% (reflecting a moderate demand contraction) and holds rents flat, producing a DSCR decline that tests covenant headroom. The stress case applies a 70% occupancy assumption with a 10% effective rent reduction, representing a severe but historically observed scenario for the submarket. At stress, DSCR falls below 1.0x, triggering the covenant breach threshold and requiring the analyst to document a recovery path and collateral liquidation analysis.
Key output metrics to report for each scenario:
The base and downside outputs inform pricing and covenant structure. The stress output informs ACL/ALLL provisioning and determines whether a specific reserve is warranted. For real estate underwriting documentation, the credit file should include all five folders above plus the analyst’s attestation that the model was independently reviewed.
How to present scenario results to a credit committee
A committee presentation that buries the key finding in slide eight fails its purpose. Structure the presentation so the decision is visible on the first page.
Presentation template:
- Slide 1 — Scenario summary: one-sentence narrative for each scenario, topline DSCR and LTV for each case, and the recommended credit action.
- Slide 2 — Sensitivity matrix: a small table showing how DSCR and covenant headroom change across the two most material drivers. A 3×3 matrix (three driver levels, two outputs) is usually sufficient.
- Slide 3 — Covenant headroom waterfall: a bar or waterfall chart showing covenant headroom declining from base to downside to stress, with the covenant floor marked as a horizontal line.
- Slide 4 — Recommended mitigants and triggers: the specific actions the committee is being asked to approve, tied to the quantitative thresholds that would activate them.
Decision criteria for committee action:
- DSCR above the covenant floor in all scenarios: approve with standard monitoring.
- DSCR breaches the floor only in the stress case: approve with a monitoring covenant or a reserve requirement, documented in the credit approval.
- DSCR breaches the floor in the downside case: require a structural mitigant (additional collateral, guaranty, cash reserve) or decline.
- LTV exceeds the policy ceiling in the downside case: require a collateral shortfall analysis and board-level escalation per policy.
Non-quantitative overlays matter too. Management quality, industry concentration, and borrower track record belong in the committee narrative even when they do not feed directly into the model. The credit lifecycle framework positions scenario analysis as a recurring activity across origination, monitoring, and workout stages, not a one-time underwriting exercise.
Macroeconomic data sources and portfolio diversification in scenario design
Scenario calibration is only as good as the data behind it. Using internal historical averages alone produces scenarios that are anchored to the institution’s own experience rather than the broader market environment.
Recommended external data sources for U.S. lenders:
- Federal Reserve H.15 release: benchmark interest rate history and forward curves for rate shock calibration.
- Bureau of Labor Statistics (BLS): sector employment and wage data for C&I revenue driver calibration.
- CoStar / MSCI Real Capital Analytics: CRE vacancy, rent, and cap rate data by submarket and property type.
- Mortgage Bankers Association (MBA): delinquency and default rate data by loan category for cohort-level stress calibration.
- Federal Reserve Senior Loan Officer Opinion Survey (SLOOS): lending standards and demand conditions as a forward-looking overlay.
Portfolio diversification affects how scenario results aggregate. A portfolio with 40% concentration in a single sector amplifies the impact of a sector-specific shock. When running portfolio-level scenarios, segment the book by sector, geography, and product type before applying shocks. The aggregate DSCR or expected loss figure for a concentrated portfolio will diverge materially from a diversified one under the same macro scenario. Risk scoring methodologies can support portfolio segmentation by mapping individual credit scores into cohort buckets for overlay analysis.
Maintaining scenario models over time:
- Refresh driver calibrations at least annually, or when a macro event materially changes the relevant benchmarks.
- Update the base case whenever the borrower delivers new financial statements.
- Document every refresh in the version log with the data source and date.
- Retire outdated scenario versions to an archive folder rather than overwriting them, preserving the audit trail.
What most analysts get wrong about scenario analysis
The most common misallocation of effort in scenario work is spending the majority of modeling time on the stress case. The stress case is the least likely outcome and the one where model precision matters least. What matters most is the accuracy of the base case and the logic of the transmission path from shock to outcome.
A base case built on normalized, audited financials with well-sourced driver assumptions is the foundation that makes every other scenario defensible. If the base case is wrong, the downside and stress cases are wrong by a larger margin. Examiners who question a stress result almost always trace the problem back to a base case that was not anchored to verifiable data.
The second underappreciated practice is pre-defining decision actions before running the model. Analysts who run scenarios first and then decide what to do with the results are more susceptible to confirmation bias, selecting the scenario framing that supports a pre-formed credit view. Setting quantitative thresholds and decision actions in advance, as the Model Reef framework recommends, removes that discretion from the analysis stage and places it where it belongs: in credit policy.
Ready to apply scenario analysis to a live deal?
CR Equity Ai Inc publishes its advance-rate grids before you apply and underwrites the asset and the deal, not just the borrower’s paperwork. Whether you are sizing a ground-up construction loan with milestone draw mechanics, stress-testing a DSCR refinance, or modeling a small-balance commercial credit from $100K to $100M, the scenario inputs you build here map directly to the underwriting criteria CR Equity Ai Inc applies. Get a preliminary quote and see how your scenario outputs align with published program terms at Crequity.
This article provides general informational guidance on loan scenario analysis methodology. It is not a substitute for professional credit, legal, or regulatory advice. Confirm current supervisory requirements with the OCC, FDIC, Federal Reserve, or a qualified compliance professional.
Sources
The sources below are the primary U.S. regulatory and practitioner references that support the guidance in this article.
For governance, documentation standards, and internal controls:
- Lending and Loan Portfolio Risk Management (Comptroller’s Handbook)
- Interagency Guidance on Credit Risk Review Systems (Federal Reserve)
- Loan Portfolio Review (FDIC Examination Policies Manual)
- Scenario stress testing in commercial loan underwriting (FinHelp)
- Financial Model for Lender Review: Essential Components and Best Practices for Loan Approval (Financely Group)
- Stress Testing Cash Flows in Middle Market Lending: A Step-by-Step Underwriting Framework (bond CAPITAL)
- Lending Scenario Analysis for Credit Teams (Model Reef)
For stress calibration and scenario design:
For modeling templates and decision frameworks:
FAQ
What is the minimum number of scenarios to run for a commercial loan?
Three scenarios — base, downside, and stress — is the practitioner minimum. For larger credits or concentrated exposures, three to five scenarios calibrated to specific drivers is the standard recommended by the FDIC’s Loan Analysis School.
What outputs must a loan scenario model produce for ACL/ALLL support?
The model must produce DSCR, LTV, covenant headroom, liquidity runway, and an expected loss mapping for each scenario. These outputs must be documented with verifiable inputs and linked to the provisioning methodology per interagency guidance.
How often should scenario models be updated?
Refresh driver calibrations at least annually and whenever the borrower delivers new financial statements or a material adverse change occurs. The version log must record every update with the data source, date, and analyst name.
What do examiners look for in a scenario analysis credit file?
Examiners look for data lineage, independent review, documented assumptions, a scenario selector with version control, and evidence that outputs informed ACL/ALLL provisioning. The OCC Comptroller’s Handbook and FDIC Examination Policies Manual both specify that documentation must be proportionate to the credit’s size and complexity.
When should scenario analysis move from Excel to a dedicated platform?
When model complexity exceeds reliable single-workbook management, when multiple analysts need concurrent access, or when governance requirements demand role-based approvals and automated audit trails, a lending analytics platform provides controls that Excel cannot replicate without significant manual overhead.