
Commercial AVMs can reach PPE10 hit rates above 70% in well-covered markets, which makes them reliable for routine screening and pricing decisions. That performance is not uniform. Accuracy depends heavily on asset class, data coverage, and transaction frequency, so readers should judge any vendor claim against PPE10 and the MISMO Common Confidence Score rather than a single advertised number.
TL;DR:
- Require vendors to report PPE10, FSD, mean and median error, plus failure rate and magnitude by asset class, using standardized calculations.
- Ask for independent rolling backtesting by asset class and confidence intervals at 90% and 95%; a single historical snapshot can miss model decay.
- Multimodal models using images, satellite data, and listing text improved performance roughly 10% to 15% over models using tabular data alone in published comparisons.
- Route mixed use, specialized, or low confidence properties to a qualified appraiser or broker price opinion, while using AVMs for routine screening and portfolio monitoring.
Table of Contents
- Metrics That Measure AVM Accuracy
- What Empirical Evidence Shows About AVM Accuracy
- Why AVM Accuracy Varies by Property and Market
- Best Practices for Testing and Auditing AVM Providers
- Using AVMs in Underwriting and Portfolio Workflows
- How Geographic Market Characteristics Affect AVM Accuracy
- Integrating Commercial AVMs Into Lending Underwriting Workflows
- Where Commercial AVMs Struggle With Complex Property Types
- Comparing AVM Accuracy Across Office, Retail, and Industrial
- Regulatory Considerations Shaping Commercial AVM Use
- Our Perspective on Measurable AVM Accuracy
- Get Valuation-Backed Funding Through CR Equity AI
- FAQ
- Sources
Metrics That Measure AVM Accuracy
Vendor accuracy claims only mean something when tied to a defined metric. PPE10 (percentage of estimates within plus or minus 10% of actual sale price) is the most widely cited benchmark, and MISMO guidance treats a PPE10 rate above 70% as high performing in many U.S. counties. A hit rate below that threshold signals a model that needs wider confidence bands or more human review.
Forecast Standard Deviation (FSD) measures dispersion rather than hit rate: a lower FSD means estimates cluster more tightly around the true value. Freddie Mac’s HVE system uses FSD thresholds, with an FSD at or below 13 classified as High confidence, and historically reported over 70% of its estimates as High confidence under that framework. Converting FSD to a confidence interval follows standard statistics: one FSD covers roughly 68% of outcomes, and two FSDs cover roughly 95%.
Mean and median percentage sales error describe the typical gap between estimate and sale price, while failure rate and failure magnitude capture how often and how badly a model misses. Together these metrics answer different questions:
- PPE10 answers how often an estimate lands within a usable range of actual price.
- FSD answers how tightly estimates cluster, which drives the width of a confidence band.
- Mean and median error show typical bias or spread across a portfolio.
- Failure rate and magnitude flag the tail risk that a single bad estimate creates.
A lender reading a vendor report should ask for all four, not just the flattering one.
What Empirical Evidence Shows About AVM Accuracy
The strongest data points come from residential testing, where sample sizes are large and transaction frequency is high. MISMO’s guidance formalizes PPE10 and a Common Confidence Score on a 0 to 100% scale tied to PPE10-style thresholds, giving lenders a standardized way to compare providers instead of relying on marketing claims.
Multimodal AI models show roughly a 10 to 15% improvement over tabular-only models, according to reviews of AVM performance, which matters because commercial assets often lack the dense comparable sales that residential models rely on. Adding images, satellite data, and text-based listing information measurably tightens error ranges.
Commercial real estate evidence is thinner and more variable than residential evidence.
Independent testers reinforce the gap between claimed and observed performance. Analysis of AVM performance metrics found that vendor-reported FSDs are frequently optimistic compared to results from blinded, bi-weekly testing across large property samples. The takeaway for commercial users: treat vendor-stated accuracy as a starting point, not a verified figure, until a third party has reproduced it.
- Residential AVM evidence is deeper and shows tighter error ranges than commercial evidence.
- Commercial accuracy varies more by asset type, with specialized assets showing wider error bands than multifamily.
- Multimodal inputs consistently outperform tabular-only models in published comparisons.
- Vendor-reported precision metrics should be checked against independent back-testing before being trusted at face value.
Why AVM Accuracy Varies by Property and Market
Accuracy swings widely because the inputs behind an estimate are never identical from one deal to the next. Four factors drive most of that variation.
Data availability and freshness matter first. A model fed current public sales records, lease data, and tax filings performs differently than one working from stale or proprietary-only sources. Transaction frequency and asset homogeneity come next: multifamily properties trade often and resemble each other, which narrows error bands, while specialized assets like self-storage or single-tenant industrial trade rarely and vary widely in configuration.
Model architecture and inputs also shape results. Multimodal models that process property images, satellite imagery, and unstructured text alongside tabular data consistently outperform tabular-only approaches. Finally, market volatility causes model decay: a model trained on last year’s pricing behavior can drift out of calibration quickly in a fast-moving market, which is why rolling back-tests matter more than a one-time validation.
- Data freshness and source quality set the ceiling on any model’s accuracy.
- Homogeneous, high-volume asset types (multifamily) tend to show tighter error bands than specialized ones.
- Multimodal inputs reduce error versus tabular-only models.
- Market volatility accelerates model decay, which is why static validation isn’t enough.
Pro Tip: Ask any AVM provider for their most recent rolling back-test results by asset class, not just an aggregate accuracy number.
Best Practices for Testing and Auditing AVM Providers
Lenders and valuation professionals should treat AVM accuracy claims the way they’d treat any underwriting input: verifiable, documented, and revisited on a schedule.
- Require PPE10, mean and median percentage error, FSD, and failure rate and magnitude in every vendor report, broken out by asset class.
- Insist on standardized calculation methods, since inconsistent methodology is a common source of inflated accuracy claims.
- Request third-party back-testing using rolling windows and cross-validation rather than a single historical snapshot.
- Ask for transparent confidence intervals at both 90% and 95% levels, with the FSD methodology behind them disclosed.
- Build in ongoing monitoring with version control, so every valuation can be traced to a specific model version and data snapshot.
Independent audits that run continuously, rather than once at onboarding, catch model decay and bias before they affect credit decisions.
| Requirement | What it reveals | Why it matters |
|---|---|---|
| PPE10 by asset class | Hit rate within plus or minus 10% of sale price | Flags which property types need wider review |
| FSD with methodology | Dispersion and confidence band width | Prevents reliance on optimistic vendor estimates |
| Rolling back-tests | Performance drift over time | Detects model decay before it affects deals |
| Model version logging | Audit trail for every valuation | Supports credit committee and regulatory review |
Using AVMs in Underwriting and Portfolio Workflows
AVMs work best as a screening and pricing tool inside a broader underwriting process, not as a standalone replacement for every valuation decision. A practical risk gate: when PPE10 hit rate and confidence score both clear a defined threshold, the AVM output can support the decision; when either falls short, an MAI appraisal or broker price opinion steps in.
- Use AVMs for initial screening, pricing guidance, and ongoing portfolio monitoring.
- Reserve full appraisals for high-value, atypical, or low-confidence-score assets.
- Reconcile AVM inputs against recent comparable sales before relying on the output.
- Log every override decision along with the model version and data snapshot used.
- Keep documentation organized for credit committee review and audit defense.
This layered approach lets a lender move faster on straightforward deals while still routing complex assets to a human appraiser, which keeps the overall credit process defensible.
How Geographic Market Characteristics Affect AVM Accuracy
AVM accuracy tracks market activity closely. Dense metro areas with frequent transactions and strong public data coverage, like large multifamily submarkets, tend to produce tighter PPE10 bands because models have more recent comparable sales to draw from. Thin markets, including many rural counties and secondary industrial corridors, offer fewer transactions, which widens FSD and lowers confidence scores even when the underlying model is sound.
Local record-keeping also matters. Counties with digitized, current tax and sales records feed cleaner data into a model than jurisdictions with lagging or inconsistent recording practices. That gap shows up directly in PPE10 performance, since MISMO’s guidance notes hit rates above 70% are achievable in many counties, implying meaningfully lower rates elsewhere.
Market volatility compounds the geographic effect. A market experiencing rapid price movement, whether from new supply, job growth, or a sudden slowdown, can outpace a model’s training data within a few quarters. That’s a separate problem from thin data: even a data-rich market can see accuracy slip if prices move faster than the model recalibrates. Reviewing an AVM’s confidence score by county or submarket, rather than trusting a national average, is the more reliable way to judge whether a given estimate is strong enough to support a lending decision on its own.
Integrating Commercial AVMs Into Lending Underwriting Workflows
Folding an AVM into underwriting works best when the valuation output is treated as one data point feeding a larger decision, not the decision itself. A typical sequence starts with an automated valuation at application intake, which informs initial pricing and loan sizing before a human underwriter reviews the file.
The confidence score attached to each valuation should trigger specific workflow steps. A high-confidence estimate can support faster movement toward term sheet issuance, while a lower score should automatically route the file toward additional documentation or a traditional appraisal. This mirrors how confidence-band transparency is meant to function: not as a single pass or fail signal, but as a graduated input that shapes how much additional diligence a deal needs.
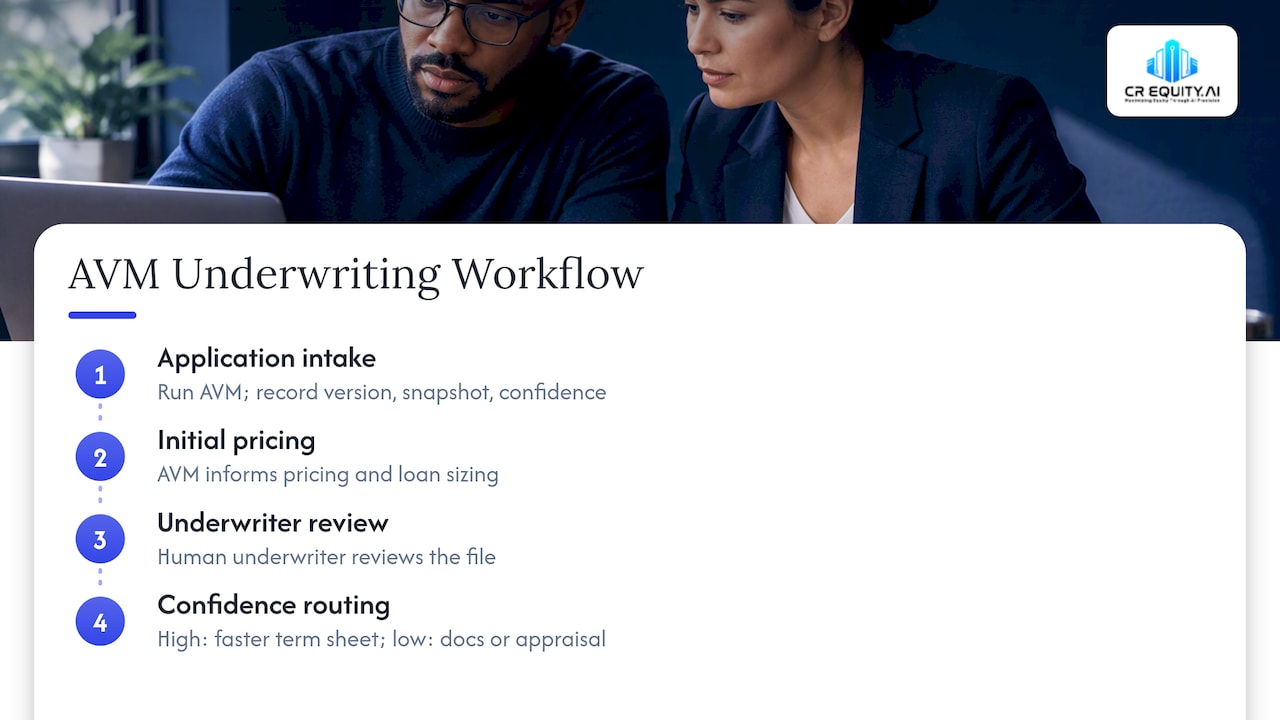
Capturing the model version, data snapshot, and confidence score at the moment of valuation also matters for later portfolio review. When a loan underwritten on an AVM estimate later needs refinancing or workout attention, having that original valuation context on file makes it far easier to assess whether the original estimate held up or whether market conditions shifted. Underwriting teams that build this capture step into their loan origination system, rather than treating it as a one-time check, get a usable audit trail without added manual work.
Where Commercial AVMs Struggle With Complex Property Types
AVMs perform best on assets that trade frequently and resemble each other, which is exactly what mixed-use buildings, adaptive reuse projects, and other unique commercial assets are not. A property combining retail on the ground floor with residential units above, for instance, doesn’t fit cleanly into either comparable set, so a model trained primarily on single-use assets has fewer true comparables to draw from.
Specialized assets, including self-storage facilities, data centers, and single-tenant industrial buildings built around one tenant’s specific needs, present a similar problem. These properties trade rarely, and when they do sell, the buyer pool and pricing logic can differ sharply from one transaction to the next. Industry reviews note that CRE accuracy is more variable than residential precisely because of this heterogeneity, and unique assets sit at the far end of that variability.
For these property types, a low confidence score from an AVM is itself useful information: it tells an underwriter to route the file toward a qualified appraiser rather than relying on the automated estimate. A broker price opinion can also serve as a faster interim check in these cases, and comparisons of BPOs and appraisals outline when each tool fits a seller or lender’s timeline. The practical rule holds across all complex property types: use the AVM’s own confidence signal to decide when a human valuation professional needs to take over.
Comparing AVM Accuracy Across Office, Retail, and Industrial
Property sector has a direct effect on how well an AVM performs, largely because it determines transaction volume and asset uniformity. Industrial properties, particularly standardized warehouse and distribution space, tend to produce more consistent AVM results because the buildings share similar specifications and trade with reasonable frequency in active logistics markets.
Retail sits in the middle. Big-box and strip retail with standard formats can support reasonably accurate AVM output, but retail assets tied to a single operator’s build-out, or properties in markets with shifting foot traffic patterns, introduce more variability. Office is often the hardest sector for AVMs to price reliably right now, since occupancy patterns, lease structures, and tenant improvement needs vary widely from one building to the next, and transaction volume in some office submarkets has thinned out enough to limit the comparable pool a model can draw from.
This sector-by-sector difference is why a single blended accuracy number for commercial AVMs can mislead. A lender evaluating an industrial acquisition loan and an office refinance should expect different confidence scores from the same AVM provider, and should weight the automated estimate accordingly rather than applying one standard of trust across every property type.
Regulatory Considerations Shaping Commercial AVM Use
Commercial AVM adoption sits within a regulatory environment built mostly around appraisal practices, with automated valuation standards catching up through industry bodies rather than a single federal mandate. MISMO’s Common Confidence Score standard gives lenders a consistent way to report and compare AVM confidence levels, which supports internal risk management and examiner review even where no specific rule requires its use.
Appraisal independence requirements, which govern when a licensed appraiser must be involved in a valuation used for lending decisions, remain the backdrop against which any AVM use gets evaluated. An AVM can inform pricing and screening, but it does not substitute for a required appraisal when regulation, loan program rules, or investor guidelines call for one. Lenders generally need to document when and why an AVM output was relied upon instead of, or alongside, a traditional valuation.
Model governance expectations are tightening as well. Guidance on AVM audits emphasizes that back-testing and validation should be continuous rather than a one-time exercise at vendor selection, which aligns with broader model risk management expectations that examiners apply to other automated decision tools in lending. Keeping clear records of model version, data inputs, and confidence scores at the time of each valuation supports a defensible position if that decision is ever reviewed.
Our Perspective on Measurable AVM Accuracy
We built our underwriting process around the idea that a valuation is only as useful as the confidence data behind it. That means tying AI-driven valuation output to published advance-rate grids, so a borrower can see the terms a given confidence level supports before a deal moves forward. We apply back-testing and confidence-band review as part of standard practice, rather than treating valuation as a single number handed off without context.
For readers who want the deeper mechanics, we’ve published research on AVM accuracy and confidence bands and a primer on how automated valuation models work in real estate lending.
— Robert Stewart Jr
Get Valuation-Backed Funding Through CR Equity AI
We underwrite the asset first, which is why a reliable valuation input matters to our lending programs. Our F.L.E.X. 50™ emergency bridge program, DSCR cash-out refinance, and commercial bridge loans all rely on valuation data to set terms quickly.

- F.L.E.X. 50™ carries a 15.00% rate for qualifying short-term deals.
- Commercial bridge loans start from 10.99%, with origination and exit fees disclosed upfront.
- DSCR refinance terms are based on rental income rather than tax returns.
If you have a deal that needs a valuation-informed decision fast, submit your deal and we’ll walk you through which program fits.
FAQ
Are AVM appraisals accurate?
AVMs can be accurate for routine valuations when PPE10 hit rates and confidence scores are high, but they are not appraisals and don’t replace one when a licensed appraisal is required. Accuracy depends heavily on data coverage and asset type, so a MISMO Common Confidence Score helps a lender judge how much to trust a given estimate.
Which valuation method is the most accurate?
No single method wins across every property type: a traditional MAI appraisal generally offers the most defensible accuracy for complex or unique assets, while a well-tested AVM can match that reliability for standardized, high-volume property types. The right choice depends on asset homogeneity, transaction frequency, and the confidence score an AVM reports for that specific case.
Which property valuation is most accurate?
Properties with frequent comparable sales and standardized features, such as multifamily buildings in active markets, tend to support the most accurate automated valuations. Specialized or infrequently traded assets, including mixed-use or single-tenant industrial buildings, generally need a licensed appraiser to reach a comparable level of confidence.
Is Zillow an AVM?
Zillow’s Zestimate functions as a residential AVM, generating automated home value estimates from public and user-submitted data rather than a licensed appraisal. It is not designed for commercial property valuation, which relies on different data sources and metrics like PPE10 and FSD.
Sources
- MISMO Publishes AVM Accuracy Testing Guidance for Lenders
- Automated Valuation Model Common Confidence Score Standard and Guidance — MISMO
- An Exposition of AVM Performance Metrics
- AI in CRE Valuation: AVMs vs. MAI Appraisals Explained | Schumacher Appraisal