

Nine numbers determine whether your origination shop is fast and profitable or slow and bleeding margin: time-to-decision, application-to-fund cycle time, approval rate, pull-through rate, pipeline conversion, cost per funded loan, abandonment rate, early payment default, and critical defect rate. Track them together and you catch friction before it costs you deals; track them in isolation and you fix one bottleneck while three others quietly grow.
Here’s the fast reference. Time-to-decision = decision timestamp minus submission timestamp; top performers land under 24 hours. Application-to-fund cycle time = fund date minus application date; modern targets run 12 to 18 days. Approval rate = approved applications ÷ total applications. Pull-through rate = funded loans ÷ approved loans. Pipeline conversion = funded loans ÷ total submissions. Cost per funded loan = total origination cost ÷ funded loans, with a market average near $11,600. Abandonment rate = incomplete applications ÷ started applications. Early payment default = loans defaulting within the first 1 to 3 payments ÷ total funded loans. Critical defect rate = loans with post-fund QC defects ÷ QC-sampled loans.
Three of these move the needle hardest on cost and competitiveness:
- Time-to-decision, because slow decisions drive abandonment and lost pipeline
- Cost per funded loan, because it captures every inefficiency upstream
- Pull-through rate, because it exposes waste between approval and closing
Key Takeaways
Loan origination efficiency depends on tracking time-to-decision, cycle time, pull-through, and cost per loan together, by channel, and acting on triggers before they become losses.
| Point | Details |
|---|---|
| Track nine core KPIs | Time-to-decision, cycle time, approval rate, pull-through, pipeline conversion, cost per loan, abandonment, EPD, and defect rate. |
| Target sub-24-hour decisions | Parallel credit, KYC, and document checks are the primary lever to hit this benchmark. |
| Benchmark cost against Freddie Mac | Top-quartile originators run near $6,900 per loan versus an $11,600 market average. |
| Segment everything by channel and product | Blended averages hide the real friction points inside a single number. |
| Roll out one lever at a time | Sequential automation pilots let you attribute improvement to the specific change made. |
This article is general information, not a substitute for advice from a qualified financial advisor. Consult a qualified financial professional about your own circumstances before acting on anything here.
Table of Contents
- Speed and Throughput: Time-to-Decision and Cycle Time
- How Do Approval and Pull-Through Rates Reveal Funnel Friction?
- Cost Per Funded Loan and Where the Money Goes
- Delinquency, Early Payment Default, and Critical Defect Rate
- Abandonment, Fallout, and Pre-Close Exception Rates
- Building a Reliable Data Model for These KPIs
- What to Do When a KPI Moves: The Improvement Playbook
- Tools, LOS Features, and Dashboard Design for Tracking KPIs
- Where Industry Benchmarks Set the Bar
- A 90-Day Plan to Stand Up Your KPI Program
- Why Application-Phase Experience Metrics Belong in Your KPI Set
- How Compliance and Audit Requirements Shape Efficiency
- How Predictive Analytics Sharpens KPI Forecasting
- Getting Your Team to Actually Adopt Metric-Driven Change
- Segmenting Metrics by Loan Type and Channel
- The One Lever I’d Prioritize Above All Others
- Sources
- FAQ
Speed and Throughput: Time-to-Decision and Cycle Time
Time-to-decision measures the interval between application submission and a credit decision. The formula is simple: decision timestamp minus submission timestamp, usually expressed in hours. Application-to-fund cycle time is broader, running from initial application to the fund date, and it captures every downstream delay, not just underwriting.

Both metrics depend on clean LOS timestamps. You need a submission timestamp, a decision timestamp, a “clear to close” timestamp, and a fund date, all tied to a single loan ID so you can calculate elapsed time without manual reconciliation.
| Performance Tier | Time-to-Decision | Application-to-Fund Cycle Time |
|---|---|---|
| Top performers | Under 24 hours | 12 to 18 days |
| Mid-market | 2 to 5 days | 20 to 30 days |
| Laggards | 5+ days | 35+ days |
These ranges come from DefiSolutions’ and Confer Solutions’ benchmarking work with mid-sized lenders, and the gap between tiers is not marginal. A lender stuck at five days on decisioning is operating in a different competitive category than one that clears in hours.
The reason gets confirmed repeatedly in industry data: decisions that stretch past roughly 24 hours materially increase abandonment risk, with abandonment commonly running near 20% industry wide. Every extra day of decision time is a day a borrower or broker can shop your deal elsewhere.
Pro Tip: Run credit pulls, KYC/AML checks, and document extraction in parallel instead of sequentially. This single workflow change is the operational lever that gets lenders under the 24-hour threshold, and it preserves human underwriting judgment rather than replacing it.
How Do Approval and Pull-Through Rates Reveal Funnel Friction?
Approval rate tells you how many submitted applications clear underwriting: approved applications divided by total applications. Pull-through rate tells you something different and arguably more important: funded loans divided by approved loans. A lender approving 70% of applications but funding only 50% of approvals has a post-approval problem, not an underwriting problem.
Pipeline conversion combines both views into one number: total funded loans divided by total submissions. If your approval rate is 75%, your pull-through is 80%, your blended pipeline conversion lands near 60%, and every stage between submission and funding is where you should be hunting for leaks.
| Metric | Formula | Healthy Range |
|---|---|---|
| Approval rate | Approved ÷ total applications | 60% to 80% |
| Pull-through rate | Funded ÷ approved | 80% to 90%+ |
| Pipeline conversion | Funded ÷ total submissions | 50% to 65% |
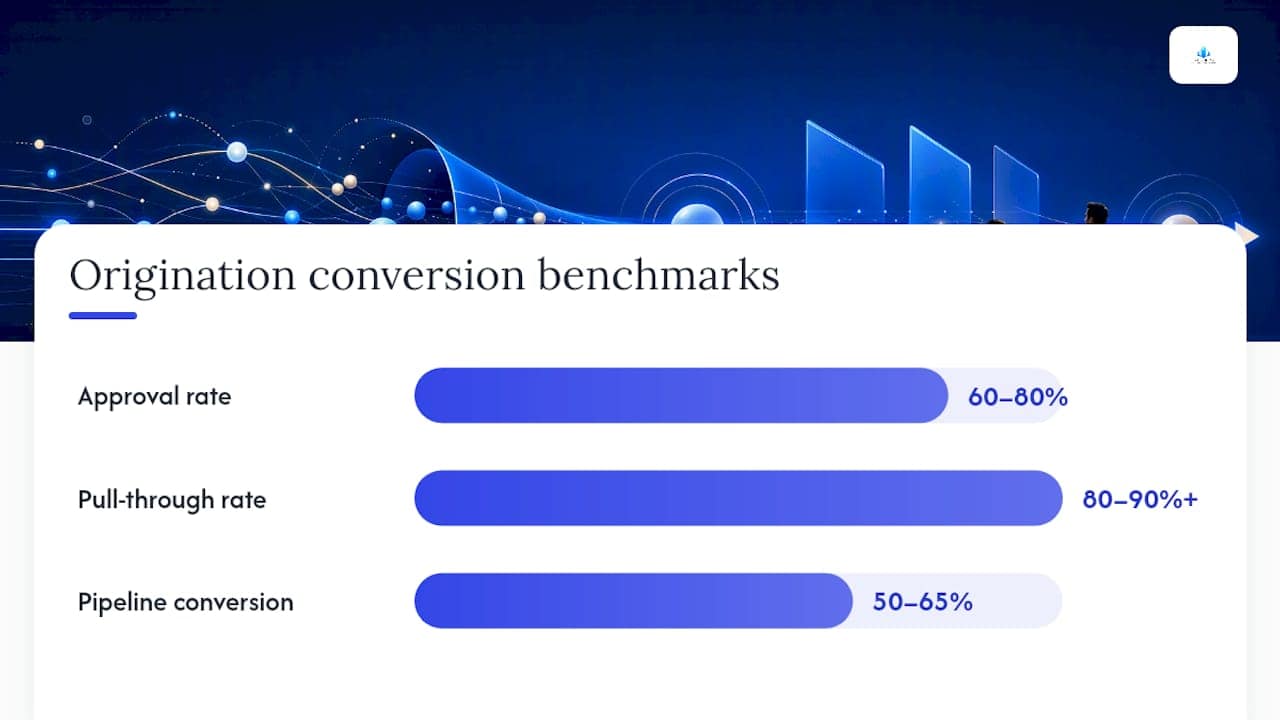
Building a stage-conversion chart, plotting the drop-off at intake, underwriting, conditional approval, and closing, exposes exactly where volume disappears. A steep drop between conditional approval and closing usually points to stipulation handling. A drop at intake usually points to application design or channel quality.
When conversion losses show up, triage in this order:
- Check intake quality first: are incomplete or low-quality applications entering the funnel from a specific channel or broker?
- Audit credit policy exceptions: is underwriting rejecting a predictable segment that a policy tweak could capture?
- Review stipulation cycle time: are conditions sitting unaddressed for days before borrowers respond?
- Isolate channel or dealer patterns: does one referral source consistently underperform on pull-through?
Cost Per Funded Loan and Where the Money Goes
Cost per funded loan equals total origination cost divided by funded loan count, and it’s the single number that rolls up every inefficiency elsewhere in the funnel. Freddie Mac’s cost-to-originate study put the market average at roughly $11,600 per loan in Q3 2023, while top-quartile originators averaged about $6,900, nearly half the market rate.
That spread is not explained by scale alone. It comes from where lenders let cost accumulate:
- Manual document review and re-keying, which eats labor hours per file
- Underwriting rework caused by incomplete initial submissions
- Extended stipulation cycles that keep files open and staff engaged longer
- Hedging and carrying costs that grow the longer a loan sits unfunded
Confer Solutions sets a modern production-cost target of $5,400 to $7,200 for tech-forward mid-sized lenders, a range that assumes meaningful document automation. Freddie Mac’s own research suggests advanced digital tools can eliminate between 2.2 and 12.3 hours of production time per loan, depending on which tools get adopted and how deeply they’re integrated into the workflow.
Delinquency, Early Payment Default, and Critical Defect Rate
Origination quality shows up downstream, and three metrics catch it early. Delinquency rate tracks the share of funded loans past due at 30, 60, and 90 days, and Statista’s commercial bank delinquency series gives you a national baseline to compare against your own book.

Early payment default (EPD) is narrower and more urgent: loans that default within the first one to three payments, divided by total funded loans. EPD spikes almost always trace back to origination decisions, not borrower circumstances that changed later.
Critical defect rate measures post-fund QC defects divided by loans sampled, and it’s your clearest signal of underwriting or income-calculation weakness. Confer Solutions recommends a target under 0.5% for mid-sized lenders running disciplined QC programs.
- Pull EPD and defect data by channel, product type, and credit tier, never as a single blended number.
- Ask whether defects cluster around a specific income-calculation method or documentation type.
- Check whether a particular referral channel or loan officer shows disproportionate EPD.
- Compare defect trends against recent underwriting policy or staffing changes.
- Report delinquency and EPD monthly, segmented by product and origination channel.
- Sample critical defects on a rolling basis, not just at quarter-end audits.
- Escalate any channel showing EPD above your portfolio average for two consecutive months.
Abandonment, Fallout, and Pre-Close Exception Rates
Abandonment rate equals incomplete applications divided by started applications. Fallout rate equals approved-but-not-funded loans divided by approved loans. Application completion rate is the inverse of abandonment, and pre-close exception rate tracks files flagged for exceptions divided by total files nearing close.
Common causes include clunky application UX, missing document uploads, manual stipulation handling, and LOS integrations that don’t talk to each other.
- Set an action trigger at 15% abandonment; above that, audit the application flow for friction points.
- Trigger a fallout review if the rate exceeds 15%, since that pattern usually traces back to slow decisioning.
- Flag pre-close exception rates above 10% for immediate underwriting policy review.
Building a Reliable Data Model for These KPIs
You can’t calculate any of these nine metrics without clean, timestamped event data flowing through your loan origination system. At minimum, capture: submission timestamp, decision timestamp, document-received timestamps, “clear to close” timestamp, fund date, channel code, product code, and loan ID as the join key across every table.
A simplified pseudocode query for time-to-decision looks like this:
SELECT loan_id, DATEDIFF(hour, submission_ts, decision_ts) AS time_to_decision FROM loan_events
Pull-through rate follows a similar pattern: count loans where status = 'funded', divide by count where status = 'approved', grouped by channel and product code. Cost-per-loan requires joining your general ledger cost allocations (labor, technology, funds cost) against funded-loan counts from the same reporting period.
Cadence matters as much as the formula:
| KPI | Reporting Cadence |
|---|---|
| Time-to-decision, abandonment | Daily |
| Pull-through, pipeline conversion | Weekly |
| Cost per funded loan, cycle time | Monthly |
| EPD, critical defect rate | Quarterly |
- Segment every report by channel (retail, wholesale, broker) and product code, never as a blended enterprise number.
- Automate the daily and weekly pulls; reserve manual review for the monthly and quarterly deep dives.
What to Do When a KPI Moves: The Improvement Playbook
Every KPI shift needs a defined response, not a shrug. Here’s the sequence for the metrics that move most often:
- Time-to-decision rising: check for queue backlogs first, then audit whether credit pulls and document extraction are running sequentially instead of in parallel.
- Pull-through falling: review stipulation turnaround time and whether post-approval conditions are getting stale in queue.
- Cost per loan climbing: isolate whether labor hours or rework are driving the increase, then target the specific document type causing re-keying.
- Abandonment spiking: test the application flow for a specific step where users drop off, usually document upload or income verification.
A simple prioritization matrix helps you sequence fixes:
- Quick wins (high impact, low effort): document AI for intake, automated stipulation reminders, parallel credit and KYC checks.
- Medium-term plays (high impact, higher effort): re-architecting sequential workflows into parallel tracks, deterministic income calculation engines.
- Longer bets (impact grows over time): full API integration between LOS, underwriting engine, and core banking systems.
Automation levers map directly to specific KPIs. Intelligent document processing (IDP) most influences cycle time and cost per loan. Parallel task execution most influences time-to-decision. Deterministic income calculation most influences approval consistency and critical defect rate. Automated stipulation handling most influences pull-through and fallout.
Pro Tip: Don’t automate everything at once. Pick the KPI causing the most cost or volume damage, apply one lever, measure for 30 days, then move to the next. Sequential rollouts beat simultaneous ones because you can actually attribute the improvement to the change you made.
Tools, LOS Features, and Dashboard Design for Tracking KPIs
A dashboard worth using needs real-time pipeline visibility, SLA timers on every stage, exception queues for stalled files, and API-driven connections to credit bureaus and document AI engines rather than batch overnight syncs.
Structure it in layers: headline KPIs at the top (time-to-decision, cost per loan, pull-through), a funnel conversion chart below that, aging queues showing files stuck past SLA, and channel drill-downs for diagnosing where a specific product or broker relationship is underperforming.
- Real-time pipeline view with SLA countdown timers on every active file
- Exception queues that flag stalled stipulations or missing documents automatically
- API integrations with credit bureaus, document AI platforms, and underwriting engines
- Alert thresholds tied to the action triggers defined in your remediation playbook
Integration friction usually shows up between the LOS and core banking systems, so budget time for that handoff before go-live.
Where Industry Benchmarks Set the Bar
Freddie Mac’s research puts the average cost to originate at roughly $11,600 per loan, against a top-quartile average near $6,900, nearly half the market rate. That spread is the clearest evidence that origination efficiency, not loan volume, separates high-margin lenders from the rest.
CR Equity Ai Inc’s own programs illustrate what modern targets look like in practice, with important caveats: results vary by loan type, borrower documentation, and program.
- Credit decisions issued in as little as 4 hours on qualifying real estate programs
- F.L.E.X. 50™ emergency bridge financing funded in 24 to 48 hours
- Investment property acquisition programs built around a roughly 10-day close
These figures reflect program-level capability, not a guarantee for every file. Compare them against the 12 to 18 day cycle-time target that industry benchmarks set for tech-forward lenders generally, and the direction of travel is clear: speed is now a measurable, trackable line item, not a marketing claim.
A 90-Day Plan to Stand Up Your KPI Program
You don’t need a year to start measuring. Three focused sprints get a functioning KPI program live.
- Days 1 to 30 (Data Discovery and Baseline): Audit LOS timestamps, confirm data quality, and calculate baseline figures for all nine KPIs.
- Days 31 to 60 (Quick Wins and Pilot): Deploy one automation lever, such as parallel credit and KYC processing, and pilot it on a single channel.
- Days 61 to 90 (Validation and Scale): Measure the pilot’s impact against baseline, then roll the change across remaining channels.
Assign clear ownership: a data owner for timestamp integrity, an operations lead for process changes, an IT liaison for LOS integration, an underwriter liaison for policy questions, and an executive sponsor to clear resource conflicts.
- Baseline target: document current cycle time and cost per loan with no changes yet
- Sprint 2 target: 10% to 15% improvement in the piloted KPI
- Sprint 3 target: validated, repeatable process ready for full rollout
Why Application-Phase Experience Metrics Belong in Your KPI Set
Efficiency metrics tell you how fast and how cheap. They don’t tell you how the borrower or broker experienced the process, and that gap costs lenders repeat business they never see coming.
Net Promoter Score (NPS) captured immediately after application submission, and again after funding, gives you a leading indicator that predicts referral volume before it shows up in your pipeline numbers. A borrower who waits five days for a decision and gets three redundant document requests will score you low even if the loan eventually funds cleanly. That borrower doesn’t refer anyone.
Pair NPS with a simple friction survey: how many times did the borrower have to resubmit a document, how many separate people did they interact with, how clear was communication about what stage their file was in. These qualitative data points often explain abandonment and fallout numbers that the quantitative metrics alone can’t diagnose.
The practical move is tying experience metrics to your existing KPI cadence rather than running them separately. Survey at the same checkpoints where you capture timestamps, so a spike in abandonment and a drop in application-phase NPS get investigated together. If NPS drops in a specific channel while cycle time stays flat, the problem is communication and transparency, not speed. If both drop together, you’re looking at a genuine process bottleneck.
How Compliance and Audit Requirements Shape Efficiency
Compliance work adds real time to every file, and pretending otherwise leads to KPI targets that no operations team can hit sustainably. QC audits, fair lending reviews, and document retention checks all consume hours that don’t show up cleanly in a simple time-to-decision formula unless you build them into the process from the start.
The lenders who handle this well don’t treat compliance as a separate stage tacked onto the end of origination. They build compliance checkpoints into the same parallel workflow that runs credit pulls and document extraction, so a KYC/AML check and a fair lending screen happen alongside underwriting rather than after it. That’s the difference between compliance adding two days to cycle time and adding zero.
Audit metrics deserve their own tracking line, separate from origination KPIs but reported on the same cadence. Track audit exception rate (files flagged during QC review divided by files sampled) and audit remediation time (how long it takes to close out a flagged exception). A rising audit exception rate often shows up as a leading indicator for critical defect rate weeks before it appears in post-fund QC.
Regulatory requirements also constrain how aggressively you can automate. Deterministic income calculation and automated stipulation handling move fast, but they still need a defensible audit trail showing a human reviewed edge cases. Build that review checkpoint into your workflow design from day one rather than retrofitting it after an examiner asks for it.
How Predictive Analytics Sharpens KPI Forecasting
Static benchmarks tell you where you stand today. Predictive models tell you where you’re headed, and that distinction matters when you’re trying to prevent a KPI breach rather than react to one after it happens.
Machine learning models trained on historical pipeline data can forecast pull-through rate for a given cohort of approved loans based on patterns in document completeness, stipulation response time, and borrower communication history. A file showing the same early warning signs as loans that historically fell out gets flagged for proactive outreach before it becomes a fallout statistic.
The same approach works for cost forecasting. Models that ingest historical labor hours, document volume, and rework rates can predict which loan types or channels are trending toward higher cost per loan before the monthly report confirms it. That gives operations managers a two- to three-week head start on corrective action instead of discovering the problem after the billing cycle closes.
Predictive default modeling extends this further, flagging loans at elevated early payment default risk based on origination-stage signals like income documentation gaps or unusually fast underwriting turnaround on complex files. This isn’t about rejecting more loans. It’s about routing flagged files to a second review before funding rather than after a payment gets missed.
Start small: pick one KPI, build a basic regression or classification model on your own historical data, and validate it against actual outcomes for two full quarters before trusting it for real-time decisions.
Getting Your Team to Actually Adopt Metric-Driven Change
The best KPI dashboard in the world fails if loan officers and underwriters see it as a surveillance tool rather than a shared operating system. Adoption problems kill more efficiency programs than bad metrics do.
Start with transparency about why each metric exists. A loan officer who understands that pull-through rate protects their own commission pipeline, because fallout means lost deals they already worked, buys in faster than one who’s just told to hit a number. Frame every KPI around what it protects for the person doing the work, not just what it reports to leadership.
Involve frontline staff in setting the action triggers described earlier in this guide. Thresholds imposed from the top get resisted; thresholds built with input from the people closest to the workflow get owned. This also surfaces operational realities that a data team alone would miss, like a specific document type that consistently causes rework regardless of how good the intake process looks on paper.
Roll out changes in the same sequential, single-lever way recommended for automation: one KPI, one process change, one channel, measured before expanding. Teams that get hit with five simultaneous process changes revert to old habits within weeks because nothing had time to prove itself.
Finally, report wins back to the team that generated them. If a pilot channel cuts cycle time by two weeks after adopting parallel task execution, tell the people on that channel exactly what changed and what it produced. That specific, attributable feedback loop is what turns a metrics program into a habit instead of a mandate.
Segmenting Metrics by Loan Type and Channel
A blended enterprise-wide KPI number hides more than it reveals. Purchase loans, refinances, bridge loans, and construction loans all carry different natural cycle times, and averaging them together produces a target nobody can actually hit or diagnose against.
Segment every core KPI by product type first. A DSCR cash-out refinance, qualified on rental income rather than tax returns, moves through underwriting differently than a ground-up construction loan with milestone draws. Blending their cycle times into one enterprise average tells you nothing actionable about either.
Channel segmentation matters just as much. Retail, wholesale, and broker-originated volume each carry different intake quality, different document completeness rates, and different abandonment patterns. A broker channel with strong pull-through but slow time-to-decision needs a different fix than a retail channel with fast decisions but high fallout.
Build your reporting structure so every dashboard view defaults to a channel and product breakdown, not a blended total. When you do need the enterprise number, calculate it as a weighted average and note the segments driving the variance, rather than presenting one flat figure that erases the real signal underneath it.
The One Lever I’d Prioritize Above All Others
If you can only fix one thing, fix document friction. Reviewing the KPIs above, the pattern repeats: slow decisions, high abandonment, rising cost per loan, and fallout all trace back more often to document handling than to underwriting judgment itself. A lender that moved intake to parallel document extraction alongside credit pulls saw cycle time compress from weeks to days, not because underwriters got faster, but because they stopped waiting on paperwork.
Sources
- 2024 cost-to-originate study — Freddie Mac
- Why are consumers abandoning online mortgage applications? — Mortgage Professional America
- Mortgage LOS KPIs mid-sized lenders should track — Confer Solutions
- Loan origination KPIs & How to measure them — DefiSolutions
FAQ
What Are the 7 Stages of Loan Origination?
The typical stages are: application, processing, underwriting, conditional approval, stipulation clearing, closing, and funding. Efficiency metrics like time-to-decision and cycle time measure how quickly a file moves through these stages combined.
Is a 2% Origination Fee High?
A 2% origination fee falls within the typical market range, which commonly runs between 0.5% and 2% depending on loan type, program, and lender. Whether it’s “high” depends more on what services and speed the fee funds than the percentage alone.
What Are the 5 C’s of Lending?
The 5 C’s are Character, Capacity, Capital, Collateral, and Conditions, the traditional framework underwriters use to evaluate borrower risk. These principles still guide manual underwriting judgment even as automation speeds up the surrounding document and verification work.
How Much Commission Do Loan Officers Make on a $500,000 Loan?
Commission structures vary widely by lender and role, typically ranging from a fraction of a percent to around 1% of the loan amount for loan officers. The actual commission amount varies depending on the specific compensation plan.
Which KPI Should a Small Lending Team Track First?
Start with time-to-decision and cost per funded loan, since both roll up multiple upstream inefficiencies into a single trackable number. Once those are stable, add pull-through rate to catch post-approval friction.