

Private lenders set loan to value ratio benchmarks by program, not by borrower profile alone. 50™ emergency bridge funded in 24–48 hours. Q2 2026 term-sheet data from 700+ lenders shows private credit carries a notable premium over institutional debt, with higher average rates compared to banks and insurers. That spread exists because private lenders extend higher advance rates on non-stabilized assets where institutional capital will not go. For exact caps and conditional overlays, run your scenario through the CR Equity Ai Inc loan calculator before requesting a term sheet.
Key Takeaways
Private lenders set advance rates by program and asset class, with CR Equity Ai Inc publishing its full grid before application so sponsors can structure equity correctly from day one.
| Point | Details |
|---|---|
| Program LTV ranges vary widely | Acquisition tops at 80% LTV; fix-and-flip reaches 100% for qualified sponsors; construction caps at 75% as-completed LTV with LTC often binding at 65–85%. |
| LTC binds on construction deals | For ground-up and heavy rehab, the loan-to-cost ratio, not LTV, sets the funded amount when total project cost is the larger constraint. |
| Sponsor track record moves the slot | A documented project history can access the top of a program’s LTV range; first-time sponsors typically see a 5–10 point reduction. |
| Published grids prevent renegotiation | CR Equity Ai Inc publishes advance-rate caps by program before application, so equity stack and closing costs can be modeled accurately upfront. |
| Use the loan calculator for firm sizing | Run your as-is value, ARV, and total project cost through the CR Equity Ai Inc loan calculator to convert a grid slot into a modeled loan amount and equity requirement. |
Table of Contents
- What are the standard loan to value ratio benchmarks by program?
- What actually drives a lender’s maximum LTV?
- How do benchmarks apply differently across programs?
- How do you use an advance-rate grid and loan calculator to model a deal?
- How can sponsors and brokers structure deals to maximize allowable LTV?
- What red flags reduce LTV or prevent full advance?
- CR Equity Ai Inc — published advance-rate grids and program caps
- CR Equity Ai Inc gives you exact numbers before you commit
- Sources
- FAQ
What are the standard loan to value ratio benchmarks by program?
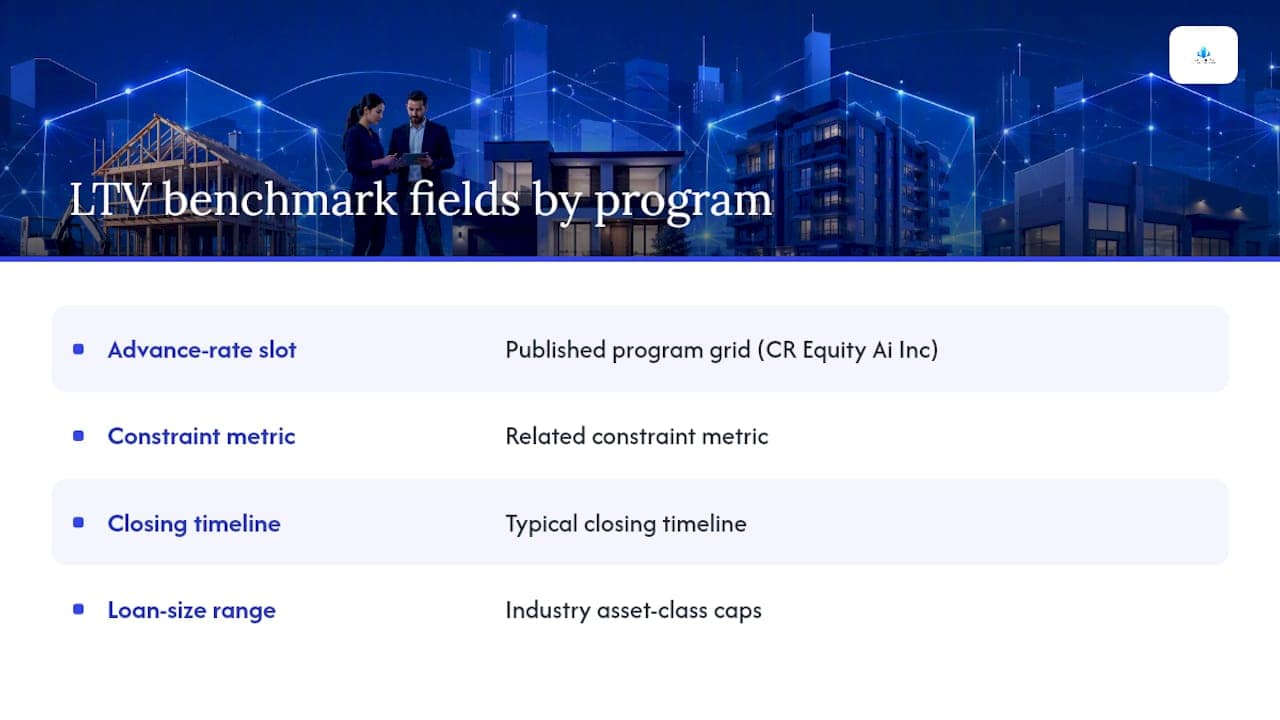
The table below maps each program to its published advance-rate slot, the related constraint metric, typical closing timeline, and loan-size range. Every CR Equity Ai Inc figure reproduces the published program grid; industry asset-class caps come from commercial real estate LTV benchmarks by asset class.
Pro Tip: Download CR Equity Ai Inc’s advance-rate grid before your first lender call. Knowing the program slot and its overlays in advance lets you structure the equity stack correctly from day one, rather than renegotiating after a term sheet lands.
What actually drives a lender’s maximum LTV?
Advance rates are not fixed numbers. They are the output of an underwriting model that weights several deal-specific variables simultaneously. Understanding those variables tells you exactly where your deal sits on the grid and what you can do to move it.
Primary drivers that move an advance-rate slot:
- Asset class. Multifamily typically supports the highest LTV (~80%) because of deep rental demand and liquid exit markets. Office and retail carry lower caps (60–75%) reflecting occupancy risk and longer re-leasing timelines.
- Sponsor track record. A sponsor with three or more completed projects of similar scope can often access the top of a program’s LTV range. A first-time sponsor on a ground-up construction deal may see the advance rate reduced by 5–10 percentage points.
- Loan purpose and exit plan. Acquisition loans on stabilized assets price tighter than bridge loans on transitional ones. A credible, documented exit (refinance with a named lender, or a signed purchase contract) supports a higher advance rate.
- NOI, occupancy, and seasoning. A property at 60% occupancy will not support the same LTV as one at 93%. Lenders typically require 90 days of stabilized occupancy before applying a stabilized-value cap.
- Appraisal approach and comps. Thin comp sets, rural markets, or special-purpose properties force appraisers toward income or cost approaches, which often produce lower values and therefore lower funded loan amounts.
- DSCR. For income-producing properties, a debt-service coverage ratio below 1.20x typically triggers a lower LTV overlay or a recourse requirement.
- Geographic market stress. Markets with declining rents, high vacancy, or limited liquidity receive a stress overlay that can reduce the advance rate by 5–15 points versus a primary market deal.
Private credit for value-add CRE commonly provides 65–80% LTV with pricing of 8–14%, reflecting the risk premium for transitional assets. Reducing nominal LTV by 5–10 percentage points on a comparable asset can improve pricing by roughly 25–75 basis points, per commercial mortgage rate sensitivity data.
Pro Tip: Read every footnote on an advance-rate grid. Conditional overlays — recourse requirements, minimum liquidity reserves, holdback percentages — often reduce the effective advance rate below the headline number. The footnote is where the real underwriting lives.
How do benchmarks apply differently across programs?
Acquisition loans
Lenders measure value on an as-is appraisal. LTV is the binding constraint. No holdback structure applies; the full loan funds at closing.
Fix-and-flip and rehab financing
The lender measures two values: as-is and ARV. The funded loan at closing covers the purchase; the rehab budget funds through a holdback, released in draws tied to completed work. LTV against ARV is the ceiling, but the lender also checks that the funded amount does not exceed a stated percentage of total project cost. For qualified sponsors, CR Equity Ai Inc’s fix-and-flip program publishes advance rates up to 100% of total project cost.

Ground-up construction
For construction and heavy rehab, LTC or as-completed LTV often binds. LTC (loan-to-cost) is the loan amount divided by total project cost, including land, hard costs, soft costs, and reserves. CR Equity Ai Inc funds ground-up construction through milestone draws on its own capital.

Small-balance commercial
Asset-class overlays apply directly. DSCR is a co-constraint: a property with strong NOI can support the top of its asset-class range, while a property with thin coverage will be underwritten to a lower slot. See CR Equity Ai Inc’s small-balance commercial program for current asset-class overlays.
DSCR cash-out refinance
Qualification is rent-based, not tax-return-based. The lender calculates DSCR as net operating income divided by annual debt service.
How do you use an advance-rate grid and loan calculator to model a deal?
- Select the program. Match your loan purpose to the correct program row on the advance-rate grid (acquisition, rehab, construction, small-balance commercial, DSCR, or bridge).
- Input the correct value basis. Use as-is appraised value for acquisition and stabilized refinance. Use ARV for fix-and-flip. Use as-completed value and total project cost for construction.
- Apply the LTV cap. Multiply the value basis by the program’s maximum LTV percentage to get the gross maximum loan amount.
- Check the LTC constraint. For construction and rehab, divide the gross loan by total project cost. If that ratio exceeds the LTC cap, the LTC cap becomes the binding number.
- Add holdbacks and reserves. Subtract the rehab holdback or construction draw reserve from the funded-at-close amount. Add the interest reserve to total loan commitment.
- Produce the equity requirement. Total project cost minus total loan commitment equals required equity. Confirm the equity figure is achievable before proceeding.
Pro Tip: *For construction loans, model interest on the full committed amount from day one, not just on drawn funds. Many sponsors underestimate carrying cost by assuming draws are slow.
Use the CR Equity Ai Inc loan calculator to run downside scenarios: reduce the as-completed value by 10%, increase contingency to 15%, and check whether the equity requirement remains fundable.
How can sponsors and brokers structure deals to maximize allowable LTV?
The advance-rate slot a lender assigns is largely a function of documentation quality and deal clarity at submission. Sponsors who submit complete packages consistently access the top of the program range.
Sponsor proof is the single highest-leverage item. A track record summary with completed project addresses, purchase prices, renovation costs, sale prices, and timelines gives the underwriter concrete evidence to support a higher advance rate. First-time sponsors should consider a co-sponsor or guarantor with a documented track record.
Pre-close documentation matters at submission, not at closing. A certified rent roll, executed leases, trailing 12-month operating statements, and a current title report submitted with the initial package reduce underwriting time and eliminate the most common reasons for advance-rate reductions.
Third-party GC bids with line-item detail support the lender’s cost review. Unsupported or round-number budgets are a common trigger for a contingency overlay that effectively reduces the funded loan.
Reserve sizing should be calculated conservatively. Lenders who see a sponsor has already sized adequate contingency and interest reserves are less likely to impose additional holdbacks.
Exit plan documentation closes the underwriting loop. A signed purchase contract, a rate lock from a take-out lender, or a detailed refinance pro forma with named comparable transactions tells the lender the loan has a clear path to repayment.
For a sponsor email to a lender, lead with: property address and type, as-is value and ARV (with comp support), total project cost breakdown, requested loan amount and program, sponsor track record summary, and exit strategy. One page. No narrative padding.
What red flags reduce LTV or prevent full advance?
Underwriters apply overlays or reduce advance rates when they encounter the following:
- Appraisal adjustments. Thin comp sets, excessive time adjustments, or a value that relies on a single outlier sale will prompt a lender to order a second appraisal or apply a haircut to the as-is value.
- Environmental issues. Phase I findings that require Phase II investigation halt the advance until remediation is documented.
- Sponsor liquidity gaps. Most private lenders require post-close liquidity equal to 3–6 months of debt service. Sponsors who cannot demonstrate reserves will face a lower advance rate or a recourse requirement.
- Unsupported GC pricing. A construction budget without executed contracts or competitive bids triggers a contingency overlay of 10–20% of hard costs.
- Title defects. Mechanics’ liens, open judgments, or probate issues must be resolved or escrowed before closing. A title holdback reduces the net funded amount.
- Unstable occupancy. Properties below 85% occupancy on a stabilized-value appraisal will be underwritten to as-is value, which is typically lower.
- Insufficient exit plan. A vague “sell or refinance” statement without supporting comps or a rate lock will prompt the lender to reduce the advance rate or shorten the loan term.
Remediation steps follow a predictable sequence: cure the title defect or escrow for it, add reserves to cover the liquidity gap, provide executed GC contracts, and document the exit with a named take-out lender or a signed LOI from a buyer.
CR Equity Ai Inc — published advance-rate grids and program caps
CR Equity Ai Inc publishes its advance-rate grid by program before you apply. The table below reproduces the program-level caps and key parameters as published on the CR Equity Ai Inc program pages.
ITIN and foreign national investors are supported across programs. CR Equity Ai Inc lends its own capital, which means draw decisions and advance-rate confirmations do not require third-party credit committee approval.
For a firm advance-rate answer on your specific deal, use the loan calculator or request a quote directly through the program page.
How these benchmarks and notes were derived
Program LTV figures in this article reproduce CR Equity Ai Inc’s published program pages and advance-rate grid. Industry asset-class caps and rate ranges draw from market reports and term-sheet aggregates, including Q2 2026 data from 700+ lenders and commercial mortgage rate benchmarks by lender type. Final terms are case-specific: market conditions, sponsor strength, and appraisal methodology all affect the funded loan amount. Use the CR Equity Ai Inc loan calculator for a firm number on your deal.
The lender’s view on advance-rate discipline
Advance-rate discipline is not conservatism for its own sake. The 329-basis-point private credit premium over institutional debt exists precisely because private lenders absorb that risk in exchange for speed and flexibility. The discipline is in pricing that risk correctly, not in refusing to take it.
CR Equity Ai Inc publishes its grids before you apply because transparency at the front end reduces renegotiation at the back end. A sponsor who knows the program cap and its overlays can structure equity correctly from the first conversation. When LTC and LTV conflict on a construction deal, LTC is the binding constraint — the funded loan cannot exceed the percentage of total project cost the program allows, regardless of what the as-completed appraisal supports.
CR Equity Ai Inc gives you exact numbers before you commit

CR Equity Ai Inc publishes its advance-rate grid by program, lends its own capital, and delivers initial decisions in as little as 4 hours. For sponsors and brokers who need a firm loan size before structuring equity, the loan calculator runs your scenario against the published grid and returns modeled outputs for LTV, LTC, holdbacks, and estimated pricing. No income verification on most real estate programs. Soft credit pull only. ITIN and foreign national investors supported. To get started, select your program on the fix-and-flip or construction program page, or run a quick quote now for an advance-rate answer on your specific deal.
Sources
Figures in this article reflect published program terms and market data available at time of writing. Use the CR Equity Ai Inc loan calculator for current, deal-specific advance-rate confirmation.
This article is general information, not a substitute for advice from a qualified financial advisor. Consult a qualified financial professional about your own circumstances before acting on anything here.
FAQ
How is LTV calculated for investment property loans?
LTV equals the loan amount divided by the appraised property value. For rehab loans, lenders use ARV (after-repair value); for construction, lenders use as-completed value alongside LTC.
When does LTC replace LTV as the binding constraint?
On ground-up construction and heavy rehab deals, LTC (loan divided by total project cost) often caps the funded amount before the LTV ceiling is reached, particularly when land value is a large share of total cost.
Where can I verify exact advance-rate caps for my deal?
CR Equity Ai Inc publishes its advance-rate grid by program on its program pages and provides a loan calculator for deal-specific modeling before you submit a full application.