

Rent roll analysis is the process of reviewing a property’s tenant and lease data to verify income, measure risk, and find upside a seller’s numbers might be hiding… The single most decisive move is this: pull a rent roll dated within the last 30 days, then compute economic occupancy and map every lease-expiration date. Those two checks tell you more about a deal in ten minutes than most pro formas reveal in ten pages.
Before you touch a formula, confirm three things:
- The rent roll’s “as-of” date, not the date it was emailed to you
- Whether physical occupancy and economic occupancy tell the same story
- How concentrated your lease expirations are in the next 12 months
Once those checks clear, reconcile scheduled rent on the roll against the gross potential rent line on the trailing twelve months (T12) statement. A gap between the two is where deals quietly fall apart.
Key Takeaways
Rent roll analysis works because it converts scattered lease data into three decisions: what a property actually earns, how exposed it is to rollover, and what it’s worth.
| Point | Details |
|---|---|
| Economic occupancy over physical | A property can show high physical occupancy while collecting far less once concessions and delinquency are factored in. |
| Loss-to-lease by unit type | Calculate it per unit type, not blended, since blending hides where the real upside sits. |
| Watch lease clustering | Expirations concentrated in one window create simultaneous rollover risk lenders and buyers both price in. |
| Reconcile every variance | Match scheduled rent to the T12’s gross potential rent and classify gaps as timing, concessions, or bad debt. |
| Financing sized to the roll | CR Equity AI underwrites DSCR and acquisition programs on verified rental income, with advance-rate grids published before you apply. |
Table of Contents
- What a Rent Roll Includes: Fields, Formats, and How It Differs From a T12
- Step-by-Step Rent Roll Analysis: A 7-Step Workflow
- Key Formulas Every Rent Roll Analysis Needs
- What Red Flags Should You Look for in a Rent Roll?
- How Rent Roll Analysis Differs by Asset Class
- Reconciling the Rent Roll to the T12
- A Quick Rent-Roll Checklist and CSV Template
- Why Rent-Roll Quality Changes How Lenders Size a Loan
- How CR Equity AI Supports Rent-Roll-Driven Financing
- Sources
- FAQ
What a Rent Roll Includes: Fields, Formats, and How It Differs From a T12
A rent roll is a line-by-line snapshot of every unit or suite in a property on a given date: who occupies it, what they pay, and under what lease terms. A T12 is a different animal entirely. It’s a trailing twelve-month income statement showing what actually got collected, month by month, including one-time fees, bad debt write-offs, and concessions that never show up on the roll. The rent roll tells you the promise; the T12 tells you the delivery. Reconciling the two is where real rent roll analysis begins.
A complete rent roll, whether for a 200-unit apartment community or a single-tenant retail box, typically includes:
- Unit or suite ID
- Tenant name (or “vacant”)
- Lease start date and lease expiration date
- In-place rent (monthly, and rent per square foot for commercial assets)
- Concessions or free-rent periods
- Security deposit amount
- Occupancy status (occupied, vacant, notice, model, employee-occupied)
- Renovated flag (yes/no, with renovation date if available)
- Unit square footage
- Move-in date and, for commercial leases, escalation schedule and NNN reimbursement terms
Most property management systems, including Yardi, RealPage, and AppFolio, export rent rolls as CSV or PDF. CSV exports are far easier to audit, but watch for quirks: some systems bury renovated-unit flags in a notes column, others split “market rent” and “asking rent” into separate fields you’ll need to reconcile before running loss-to-lease math. Always ask for the CSV, not just the PDF summary.
Step-by-Step Rent Roll Analysis: A 7-Step Workflow
Running a rent roll analysis is not a single calculation. It’s a sequence, and skipping a step early usually means redoing work later. Here’s the order that works, drawn from the seven-step framework most CRE underwriters follow.
1. Verify the date and provenance
Confirm the “as-of” date sits within the last 30 days. If it’s older, or if the seller can’t produce a recent export, request an updated pull before you do anything else. A stale rent roll is the single most common reason a deal’s numbers unravel during diligence.
2. Calculate physical and economic occupancy
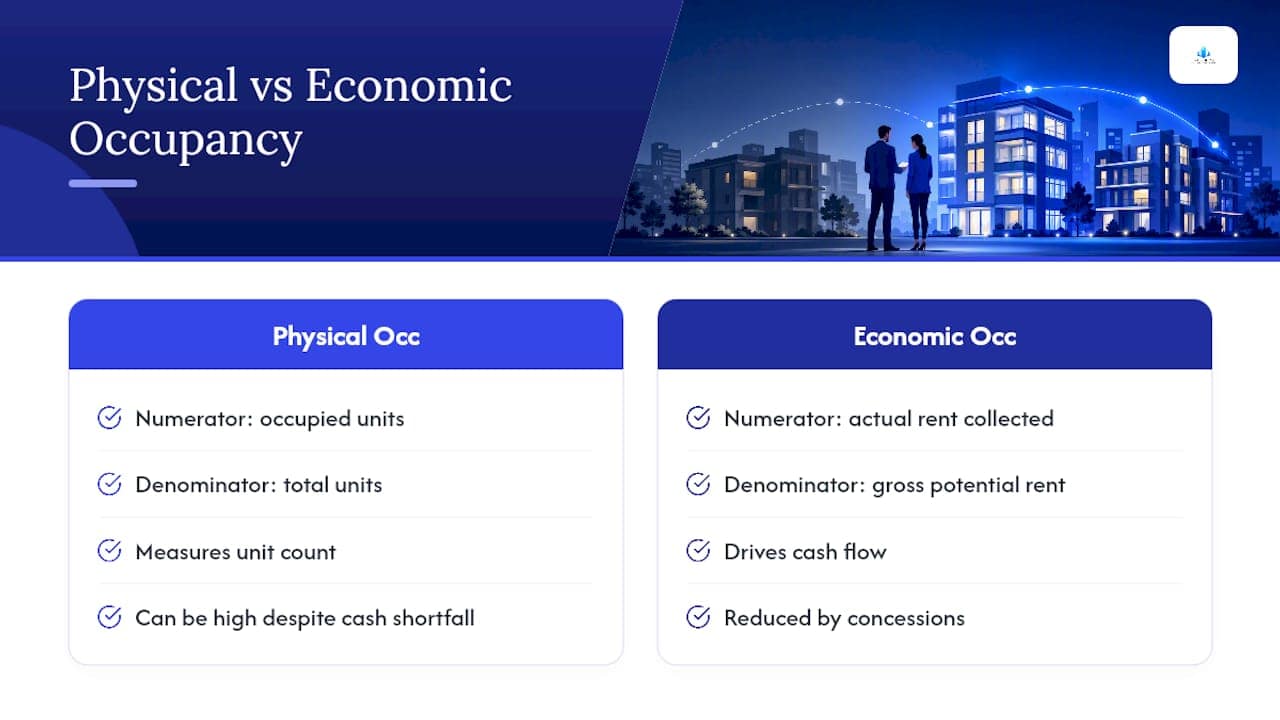
Physical occupancy counts occupied units against total units. Economic occupancy measures actual collected rent against gross potential rent, and it’s the number that actually drives cash flow. A property can show high physical occupancy but significantly lower economic occupancy once you factor in concessions, delinquency, and non-paying occupied units. That gap is the number lenders underwrite to.
3. Compute average in-place rent by unit type
Never blend averages across a whole property. A $1,450 average rent across a 100-unit community tells you almost nothing if that number blends studios at $1,050 with three-bedrooms at $2,100. Break the average down by unit type: studio, one-bedroom, two-bedroom, and so on. For commercial assets, break it down by suite size band or use type instead.
4. Calculate loss-to-lease per unit type
Loss-to-lease measures the gap between in-place rent and current market rent, and it’s arguably the single most important metric for anyone underwriting a value-add deal. Calculate it unit type by unit type, not as one blended property-wide figure. Blending hides exactly where the upside sits, and where it doesn’t.
5. Build lease-expiration buckets and compute WALT
Sort every lease into buckets: 0 to 90 days, 91 to 180 days, 181 to 365 days, 1 to 2 years, and 2-plus years. This rollover matrix shows you how much income is exposed to renewal risk in the near term. From there, calculate weighted average lease term (WALT), the rent-weighted average time remaining across all leases.

6. Label renovated versus unrenovated units
If the seller claims a renovation premium, verify it unit by unit. Compare renovated-unit rents against unrenovated units of the same floor plan. A premium that doesn’t materialize in the actual data is a red flag on the seller’s entire value-add thesis, not just that line item.
7. Flag anomalies and request supporting documents
Any rent that looks too high, too low, or inconsistent with its neighbors deserves a lease pull. Request the actual lease, the resident or tenant ledger, and, where relevant, a sample of amendments. Tie every occupied unit back to a lease, amendment, or ledger entry and treat any unit you can’t document as a material underwriting exception.
Pro Tip: Run loss-to-lease against the lease-expiration buckets together, not separately. A unit with high loss-to-lease that doesn’t expire for two years isn’t capturable upside next year, it’s a Year 3 story at best.
This workflow mirrors the diligence sequence used in broader real estate underwriting, where rent-roll conclusions feed directly into debt-sizing assumptions.
Key Formulas Every Rent Roll Analysis Needs
Four calculations do most of the analytical heavy lifting. Each one is simple arithmetic, but the interpretation is where deals get won or lost.
Physical occupancy = Occupied units ÷ Total units. A building with most units occupied demonstrates high physical occupancy.
Economic occupancy = Actual rent collected ÷ Gross potential rent (rent if every unit were leased at market with zero delinquency). Properties often show a gap between gross potential rent and actual collected rent, reflecting concessions, delinquency, or non-revenue units, with economic occupancy being the key driver of Year 1 NOI assumptions.
Loss-to-lease = (Market rent minus in-place rent) ÷ Market rent, calculated per unit type. Loss-to-lease should be calculated per unit type by comparing in-place rents to market rents provided by rent comp services. Rent comp services provide the market-rent baseline this calculation depends on.
WALT (weighted average lease term) = Sum of (each lease’s remaining term × its rent) ÷ Total rent. A property where large, long-term commercial tenants dominate the rent roll will show a WALT far higher than physical lease-count average suggests, because the calculation weights by dollars, not by unit count.
| Metric | Formula | What it reveals |
|---|---|---|
| Physical occupancy | Occupied units ÷ Total units | Basic space utilization |
| Economic occupancy | Collected rent ÷ Gross potential rent | Actual cash performance |
| Loss-to-lease | (Market rent − in-place rent) ÷ Market rent | Upside by unit type |
| WALT | Σ(term × rent) ÷ Total rent | Rollover risk exposure |
This ties directly into valuation. The income approach converts net operating income into value using V = I ÷ R, where NOI excludes capital expenditures, debt service, depreciation, and amortization. Every rent roll adjustment you make, whether it’s stripping out a bad-debt spike or normalizing a concession, flows directly into that NOI number and, from there, into the valuation math underwriters rely on.
What Red Flags Should You Look for in a Rent Roll?
Certain patterns show up again and again in rent rolls that later blow up an underwriting model. Catching them early costs you an afternoon of extra diligence. Missing them costs you Year 1 NOI.
- A rent roll dated more than 30 days out, or one the seller can’t reproduce on request
- Month-to-month leases exceeding roughly 20% of total units, which signals either high turnover risk or a management team letting leases lapse without renewal
- Lease-expiration clustering, where a disproportionate share of leases expire in the same 90-day window, creating simultaneous rollover risk
- Below-market rents with no documented renovation, which usually means the loss-to-lease story is aspirational rather than earned
- Concessions or free-rent periods that show up on individual leases but not in the T12’s income line, effectively hiding real economic occupancy
- A scheduled rent total that runs meaningfully higher than the average monthly gross potential rent shown on the T12, which requires investigation into whether it reflects legitimate recent increases or an inflated roll
- Related-party tenants or a single tenant representing an outsized share of total rent, both of which concentrate risk in ways a blended cap rate won’t show
Pro Tip: When scheduled rent on the roll exceeds T12 gross potential rent, don’t assume the worst. Request the leases signed in the last 90 days first. Legitimate rent increases show up in a paper trail; inflated numbers don’t.
Concessions deserve special attention. Free rent and fee waivers baked into recently signed leases often never make it into the T12’s income line, which means the rent roll can look stronger than the property’s actual collections history supports.
How Rent Roll Analysis Differs by Asset Class
A one-size-fits-all rent roll checklist doesn’t survive contact with different property types. What matters most in a 300-unit apartment complex barely registers in a single-tenant industrial building, and vice versa.
Multifamily rent rolls run unit-level, with loss-to-lease and the renovated-versus-unrenovated split doing most of the analytical work. Self-storage operates almost entirely on month-to-month agreements, so the comparison that matters is street rate versus in-place rate, not lease-expiration schedules. Industrial, office, and retail assets shift the focus to rent per square foot, triple-net (NNN) reimbursement structures, and tenant credit quality, since a handful of long-term leases can define the entire deal.
| Asset class | Primary focus | Typical lease structure | Key red flag |
|---|---|---|---|
| Multifamily | Loss-to-lease, renovated split | 12-month leases | High MTM concentration |
| Self-storage | Street rate vs. in-place rate | Month-to-month | Rate erosion vs. street pricing |
| Industrial/office/retail | Rent/SF, NNN structure, tenant credit | Multi-year, often 5 to 10 years | Tenant concentration, near-term rollover |
These asset-class distinctions matter because the same rent-roll figure means something different depending on what’s being underwritten. An 8% loss-to-lease in a 400-unit multifamily property represents a portfolio-wide repricing opportunity spread across dozens of leases.
Reconciling the Rent Roll to the T12
The rent roll shows what’s scheduled to be paid. The T12 shows what actually got collected. Reconciling the two is the diligence step that separates a defensible underwriting model from a hopeful one.
- Compare total scheduled rent on the roll against the average monthly gross potential rent (GPR) line on the T12; a variance beyond a few percentage points needs an explanation
- Request the actual leases for any unit whose rent looks unusual, along with resident or tenant ledgers showing payment history
- Pull a sample of leases signed within 90 days of the rent roll date, since that’s where hidden concessions cluster
- Classify every variance you find as one of three things: a timing difference, a documented concession, or bad debt, then model each differently in your Year 1 NOI
- If the gap points to real, unresolved risk, negotiate seller credits, a rent-roll holdback, or an operating reserve rather than accepting the seller’s number at face value
A variance that traces to a legitimate rent increase strengthens the deal. A variance that traces to an inflated rent roll should get modeled conservatively until leases prove otherwise, not averaged into your base case.
A Quick Rent-Roll Checklist and CSV Template
Keep this on hand for the first pass on any deal:
- Confirm the rent roll date is within 30 days
- Reconcile scheduled rent to T12 gross potential rent
- Compute economic occupancy, not just physical occupancy
- Identify month-to-month percentage and top three tenants by rent share
- Map every lease expiration into rollover buckets
For your own CSV template, build columns for: unit, tenant, lease start, lease expiration, in-place rent, market rent, concessions, deposit, occupancy status, square footage, renovated flag, and a free-text notes field.
| Rollover bucket | Timeframe | Modeling use |
|---|---|---|
| Near-term | 0 to 90 days | Immediate renewal risk |
| Short-term | 91 to 180 days | Next-quarter planning |
| Medium-term | 181 to 365 days | Year 1 rollover exposure |
| Long-term | 1 to 2 years | Year 2 capture potential |
| Extended | 2-plus years | Low near-term risk |
Why Rent-Roll Quality Changes How Lenders Size a Loan
Rent-roll verification isn’t an academic exercise for lenders, it directly changes debt sizing. When collections lag scheduled rent, or concessions understate true vacancy cost, DSCR-based programs apply conservative haircuts to in-place income before calculating loan proceeds.
Lenders that underwrite the asset itself, rather than relying solely on the borrower’s stated numbers, apply the same reconciliation discipline outlined above before sizing proceeds. That discipline protects both sides of the transaction from a rent roll that overstates what the property actually delivers.
— Robert
How CR Equity AI Supports Rent-Roll-Driven Financing
Once your rent roll analysis is done, financing sized to the wrong number wastes the work. CR Equity AI underwrites DSCR cash-out refinance and acquisition programs on the rental income your analysis actually produces, not on tax returns or income verification most lenders require. That means the economic occupancy and loss-to-lease figures you calculated feed directly into how your deal gets sized, instead of getting overridden by a generic underwriting box.

Small balance commercial loans run from $100,000 to $100 million with advance-rate grids published before you apply, so you know your leverage range before submitting a package. If your rent roll analysis surfaces a renovation-driven loss-to-lease opportunity, fix-and-flip financing supports qualified sponsors at up to 100% LTV. Decisions land in as little as four hours because underwriting focuses on the asset and the rent roll itself, not paperwork alone. Start by reviewing the small balance commercial program to see how your numbers translate into loan terms.
Sources
For deeper reference, HUD and state appraisal manuals outline the income approach to value, while rent-comp platforms like Rentometer supply market-rent baselines for loss-to-lease work. The Investopedia income approach primer covers NOI mechanics in more depth.
- How to Analyze a Rent Roll for CRE Acquisitions
- How to Analyze a Rent Roll in Commercial Real Estate | AcquiOS
- Income approach (Investopedia)
- Rentometer — rent estimates and comps
FAQ
What Does a Rent Roll Tell You?
A rent roll tells you who occupies each unit, what they pay, when their lease expires, and whether the property’s income is stable, growing, or exposed to near-term rollover risk.
What Is a Rent Roll Example?
A basic rent roll example lists each unit’s ID, tenant name, lease start and expiration dates, in-place rent, deposit amount, and occupancy status, exported as a dated CSV or PDF from the property management system.
How Does CR Equity AI Use Rent Roll Data in Underwriting?
CR Equity AI’s DSCR and acquisition programs size loan proceeds based on verified rental income from the rent roll and T12 reconciliation, rather than relying on borrower income verification or tax returns.