
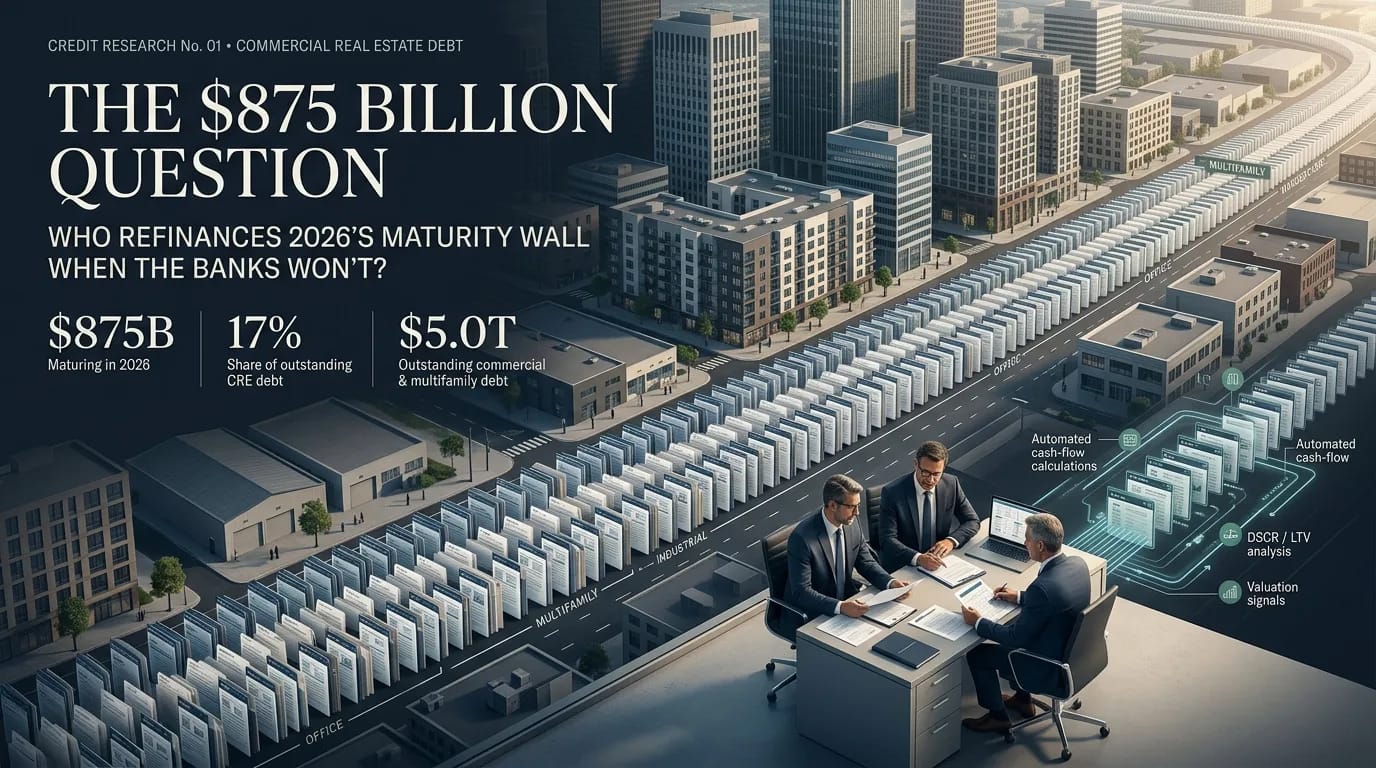
Who refinances 2026’s maturity wall when the banks won’t?
The binding constraint is not capital. It is the number of files a human underwriter can price before the clock runs out.
KEY FIGURES
| $875B | 17% | 25% | $4T+ |
|---|---|---|---|
| Commercial & multifamily debt maturing in 2026 | Share of the $5.0T outstanding book | Of CMBS and structured balances maturing this year | Maturing across the 2025–2029 window |
The Maturity Wall Is a Queue
The maturity wall is usually described as a cliff. That framing is wrong, and the error is expensive, because it points sponsors and allocators at the wrong risk. A cliff is a solvency event. What the market is actually experiencing is a queue — a very long line of individually financeable loans waiting for someone with the capacity to underwrite them, one at a time, before their clocks expire.
The distinction matters because the two problems have different solutions. If the issue were solvency, the answer would be more equity. If the issue is queue length, the answer is throughput. And throughput, not capital, is what the private credit market is short of in 2026.
Section 01 · What Actually Matures, and Who Is Holding It
The headline figure most sponsors have seen this year comes from the Mortgage Bankers Association’s survey of loan maturity volumes: roughly $875 billion of commercial and multifamily mortgage debt scheduled to mature in 2026, against approximately $5.0 trillion outstanding. That is about 17% of the entire book coming due in a single calendar year. It is also, notably, down from roughly $957 billion in 2025 — a decline of about 9% year over year, which suggests the peak of the wave has passed even as the absolute volume remains historically large.
You will also see a much smaller number circulating — figures in the $70–80 billion range drawn from Trepp’s CMBS hard-maturity data. Both numbers are correct. They measure different things. The CMBS figure captures only securitized paper; it excludes bank loans, life company loans, and everything sitting inside debt funds, mortgage REITs and specialty finance vehicles. If you are a sponsor with a maturing regional bank loan on a 40-unit asset in Ohio, the CMBS number tells you nothing about your position.
The composition matters more than the total, because maturity is not distributed evenly across lender types. Depositories are seeing roughly a fifth of their CRE balances come due this year. CMBS and structured product holders are seeing a quarter. Life companies are at roughly a tenth, and agency and GSE multifamily and health care paper — the most durable financing in the market — sits at a fraction of that.
Exhibit 1 · Where the 2026 Maturities Are Concentrated
Share of each lender group’s outstanding commercial and multifamily balances scheduled to mature during calendar 2026.
| Lender Group | 2026 Maturing |
|---|---|
| CMBS & structured | 25% |
| Depositories | 21% |
| Life insurance | 10% |
| Agency / GSE | 4% |
Source: CR Equity AI analysis of Mortgage Bankers Association loan maturity survey data. Percentages represent share of each group’s own outstanding balances, not share of the $875B total.
Read that exhibit as a map of where the refinancing conversation is going to happen. The paper least likely to be renewed on its existing terms sits with the two groups carrying the heaviest maturity concentration — and one of those groups has spent three years telling its regulators and shareholders it intends to shrink its commercial real estate book.
Section 02 · The Bank Exit Is Structural, Not Cyclical
It is tempting to read bank retrenchment as a temporary posture that reverses when rates fall. The evidence points the other way. Balance-sheet decisions driven by capital treatment, concentration limits and examiner attention do not unwind because the ten-year rallies fifty basis points. A bank that has decided to reduce CRE exposure as a matter of strategy is not a bank that competes for your extension at par.
Layer on the rate environment. The Federal Reserve held its target range at 3.50%–3.75% at its July meeting — a fifth consecutive hold, with dissents leaning toward a hike rather than a cut. The 30-year fixed averaged near 6.7% in early August. Loans written in 2015 through 2021 were underwritten against a cost of capital that no longer exists, on values that in many segments have not grown to compensate. The proceeds a new loan generates today frequently fall short of the payoff on the old one, and that gap has to be filled by cash, by preferred equity, by mezzanine, or by a lender willing to structure around it.
The capital to fill that gap exists. Private credit raised it. What has not scaled is the human capacity to underwrite several hundred thousand idiosyncratic files inside a maturity clock.
Section 03 · The Bottleneck Nobody Prices
Here is the arithmetic that rarely appears in maturity wall commentary. A competent commercial underwriter carrying a mixed book of small-balance and middle-market files completes somewhere between four and eight full credit workups a month. Not screens — completed files, with independently derived cash flow, verified collateral, structured conditions and a memo a committee will actually approve.
Now divide the queue. Even setting aside the institutional-scale transactions that will be worked by name, the small-balance and lower-middle-market segment of the 2026 maturity book runs to tens of thousands of individual loans. At four to eight files per underwriter per month, clearing that queue inside a twelve-month window is not a capital allocation problem. It is a staffing problem that no lender in the market has solved by hiring, because the underwriters do not exist to hire.
The practical consequence is triage. Manual shops respond to queue overload the only way they can: they raise their minimum deal size, they decline anything with a complication rather than structure it, and they slow-walk everything else. Each of those responses is individually rational and collectively terrible for the market. It is also why the sponsors with the least access to capital are the ones with the tightest clocks.
See What Throughput Actually Looks Like
AIVAA derives independent cash flow, runs the constraint walk and returns sized terms with the binding constraint named — on every file, not just the large ones.
Section 04 · What Changes When the Engine Underwrites
An AI-native origination platform does not remove credit judgment. It removes the manual labor that credit judgment is currently buried under — document sorting, financial spreading, ratio computation, comparable retrieval, memo assembly — so that human attention lands where it creates value: structure, exceptions, borrower context and the decision to fund.
Three architectural choices do most of the work:
1. Independent Cash Flow Derivation
The engine builds net operating income from third-party rent, tax and insurance data rather than accepting the borrower’s pro forma. The coverage ratio that comes out the other side is the lender’s number, produced before the term sheet rather than after the appraisal — which is when most retrades happen.
2. Constraint-Based Sizing That Names the Binding Constraint
Rather than returning a flat approve or decline, the engine walks every leverage and coverage test, sizes to the lowest passing amount, and reports which test bound the loan. A sponsor told “your file is constrained by coverage at 1.18x, not by loan-to-value” can act on that. A sponsor told “declined” cannot.
3. Conditions Instead of Declines
Most of what a manual shop declines is not uncreditworthy — it is inconvenient to structure. When the marginal cost of structuring a file approaches zero, the correct response to elevated risk is to price it: lower leverage, higher rate, an interest reserve, a documented cure path.
None of this is a claim that software approves loans. Every file still passes a human approve-and-fund gate, every decision carries a hashed audit trail, and every exception is logged with its operands and approval level. The engine’s job is to make sure the human is looking at a complete, verified, correctly computed file on day two instead of day thirty.
Section 05 · The Small-Balance Blind Spot
Ask an institutional lender about the maturity wall and you will hear about office towers and large multifamily. Ask a regional bank’s workout desk and you will hear about the $600,000 mixed-use building on a main street, the eleven-unit walk-up, the owner-user industrial condo. Those loans do not appear in headline coverage and they do not clear the minimum deal size at most debt funds.
They also represent, in aggregate, an enormous share of the maturing book by loan count — and the sponsors behind them are the least equipped to absorb a failed refinance. They typically hold one to ten properties. They do not have a capital markets desk. Their extension request is being evaluated by a bank that has already decided to shrink the portfolio they are sitting in.
This is the segment where underwriting throughput converts directly into market access. It is the reason we built the engine to run the same disciplined credit process on a $250,000 file that it runs on a $25 million one, at the same speed, with the same documentation standard.
Section 06 · What to Do 180 Days Out
If you hold a loan maturing inside the next two quarters, the window in which you have leverage is now, not thirty days before payoff. A short, unglamorous checklist:
Exhibit 2 · The 180-Day Refinance Sequence
What to have in hand, and when, to keep options open through payoff.
| Days Out | Action | Why It Matters |
|---|---|---|
| 180 | Pull a current rent roll, trailing 12, tax bill and insurance binder into one folder. | Every week of document assembly is a week subtracted from your negotiating position. |
| 165 | Get an independent coverage read at today’s rate — not your pro forma. | Tells you immediately whether you face a proceeds gap and how large it is. |
| 150 | Open the extension conversation with the incumbent lender in writing. | Their answer is information. A soft “probably” is a no with better manners. |
| 120 | Solicit indicative terms from at least two non-bank sources. | Competitive tension is the only reliable pricing mechanism in a thin market. |
| 90 | Decide the gap-fill: cash, preferred, mezzanine, or partial paydown. | Structuring capital takes longer to source than senior debt. |
| 60 | Order valuation and title; lock the structure. | Third-party turn times, not lender decisions, are the usual cause of a blown payoff date. |
Illustrative sequence for business-purpose commercial and investment property loans. Not a commitment to lend; timelines vary by asset, market and file condition.
Two closing observations for allocators. First, current stress in private credit is concentrated in corporate direct lending, not commercial real estate, and the transmission risk to CRE is indirect — through bank credit lines to lending vehicles and through LP confidence in fundraising. Second, and more consequentially: the firms that capture this cycle will not be the ones with the most capital. They will be the ones that can underwrite the most files per month without lowering the standard. That is a technology position, and it compounds.
The wall is a queue. Queues are cleared by throughput.
Learn more at crequity.ai/aivaa.
Sources & Further Reading
- Mortgage Bankers Association, Commercial Real Estate Survey of Loan Maturity Volumes — 2026 maturity volumes and outstanding balances.
- Trepp, CMBS Hard Maturity data — securitized-only maturity schedules.
- CBRE Insights, Private Credit Stress: Contained or Contagious? (June 2026) — transmission channels between private credit stress and CRE.
- Board of Governors of the Federal Reserve System — FOMC statement and H.15 selected interest rates, July–August 2026.
- Bloomberg, Yahoo Finance and Forbes — ongoing coverage of bank CRE retrenchment, non-bank lender originations and private credit fundraising.
Next Step
Have a 2026 Maturity? Get Real Terms in Five Minutes.
Enter the property and the payoff. AIVAA derives the coverage independently, sizes the loan against every constraint, and tells you which one is binding — before you spend a dollar on third-party reports.
© 2026 CR Equity AI, Inc. · 2308 Mount Vernon Ave, Suite 206, Alexandria, VA 22302.
This publication is for educational and informational purposes only and does not constitute financial, legal, tax or investment advice. It is not a commitment to lend. All loan products, rates, terms and leverage are subject to underwriting, credit approval, property eligibility and change without notice. Business-purpose lending only. Figures cited reflect data available as of the publication date and are drawn from the sources listed. Third-party publications are referenced for attribution only and are not affiliated with, and do not endorse, CR Equity AI, Inc.